

Monitoring
Dashboard
Updated: November 16, 2026
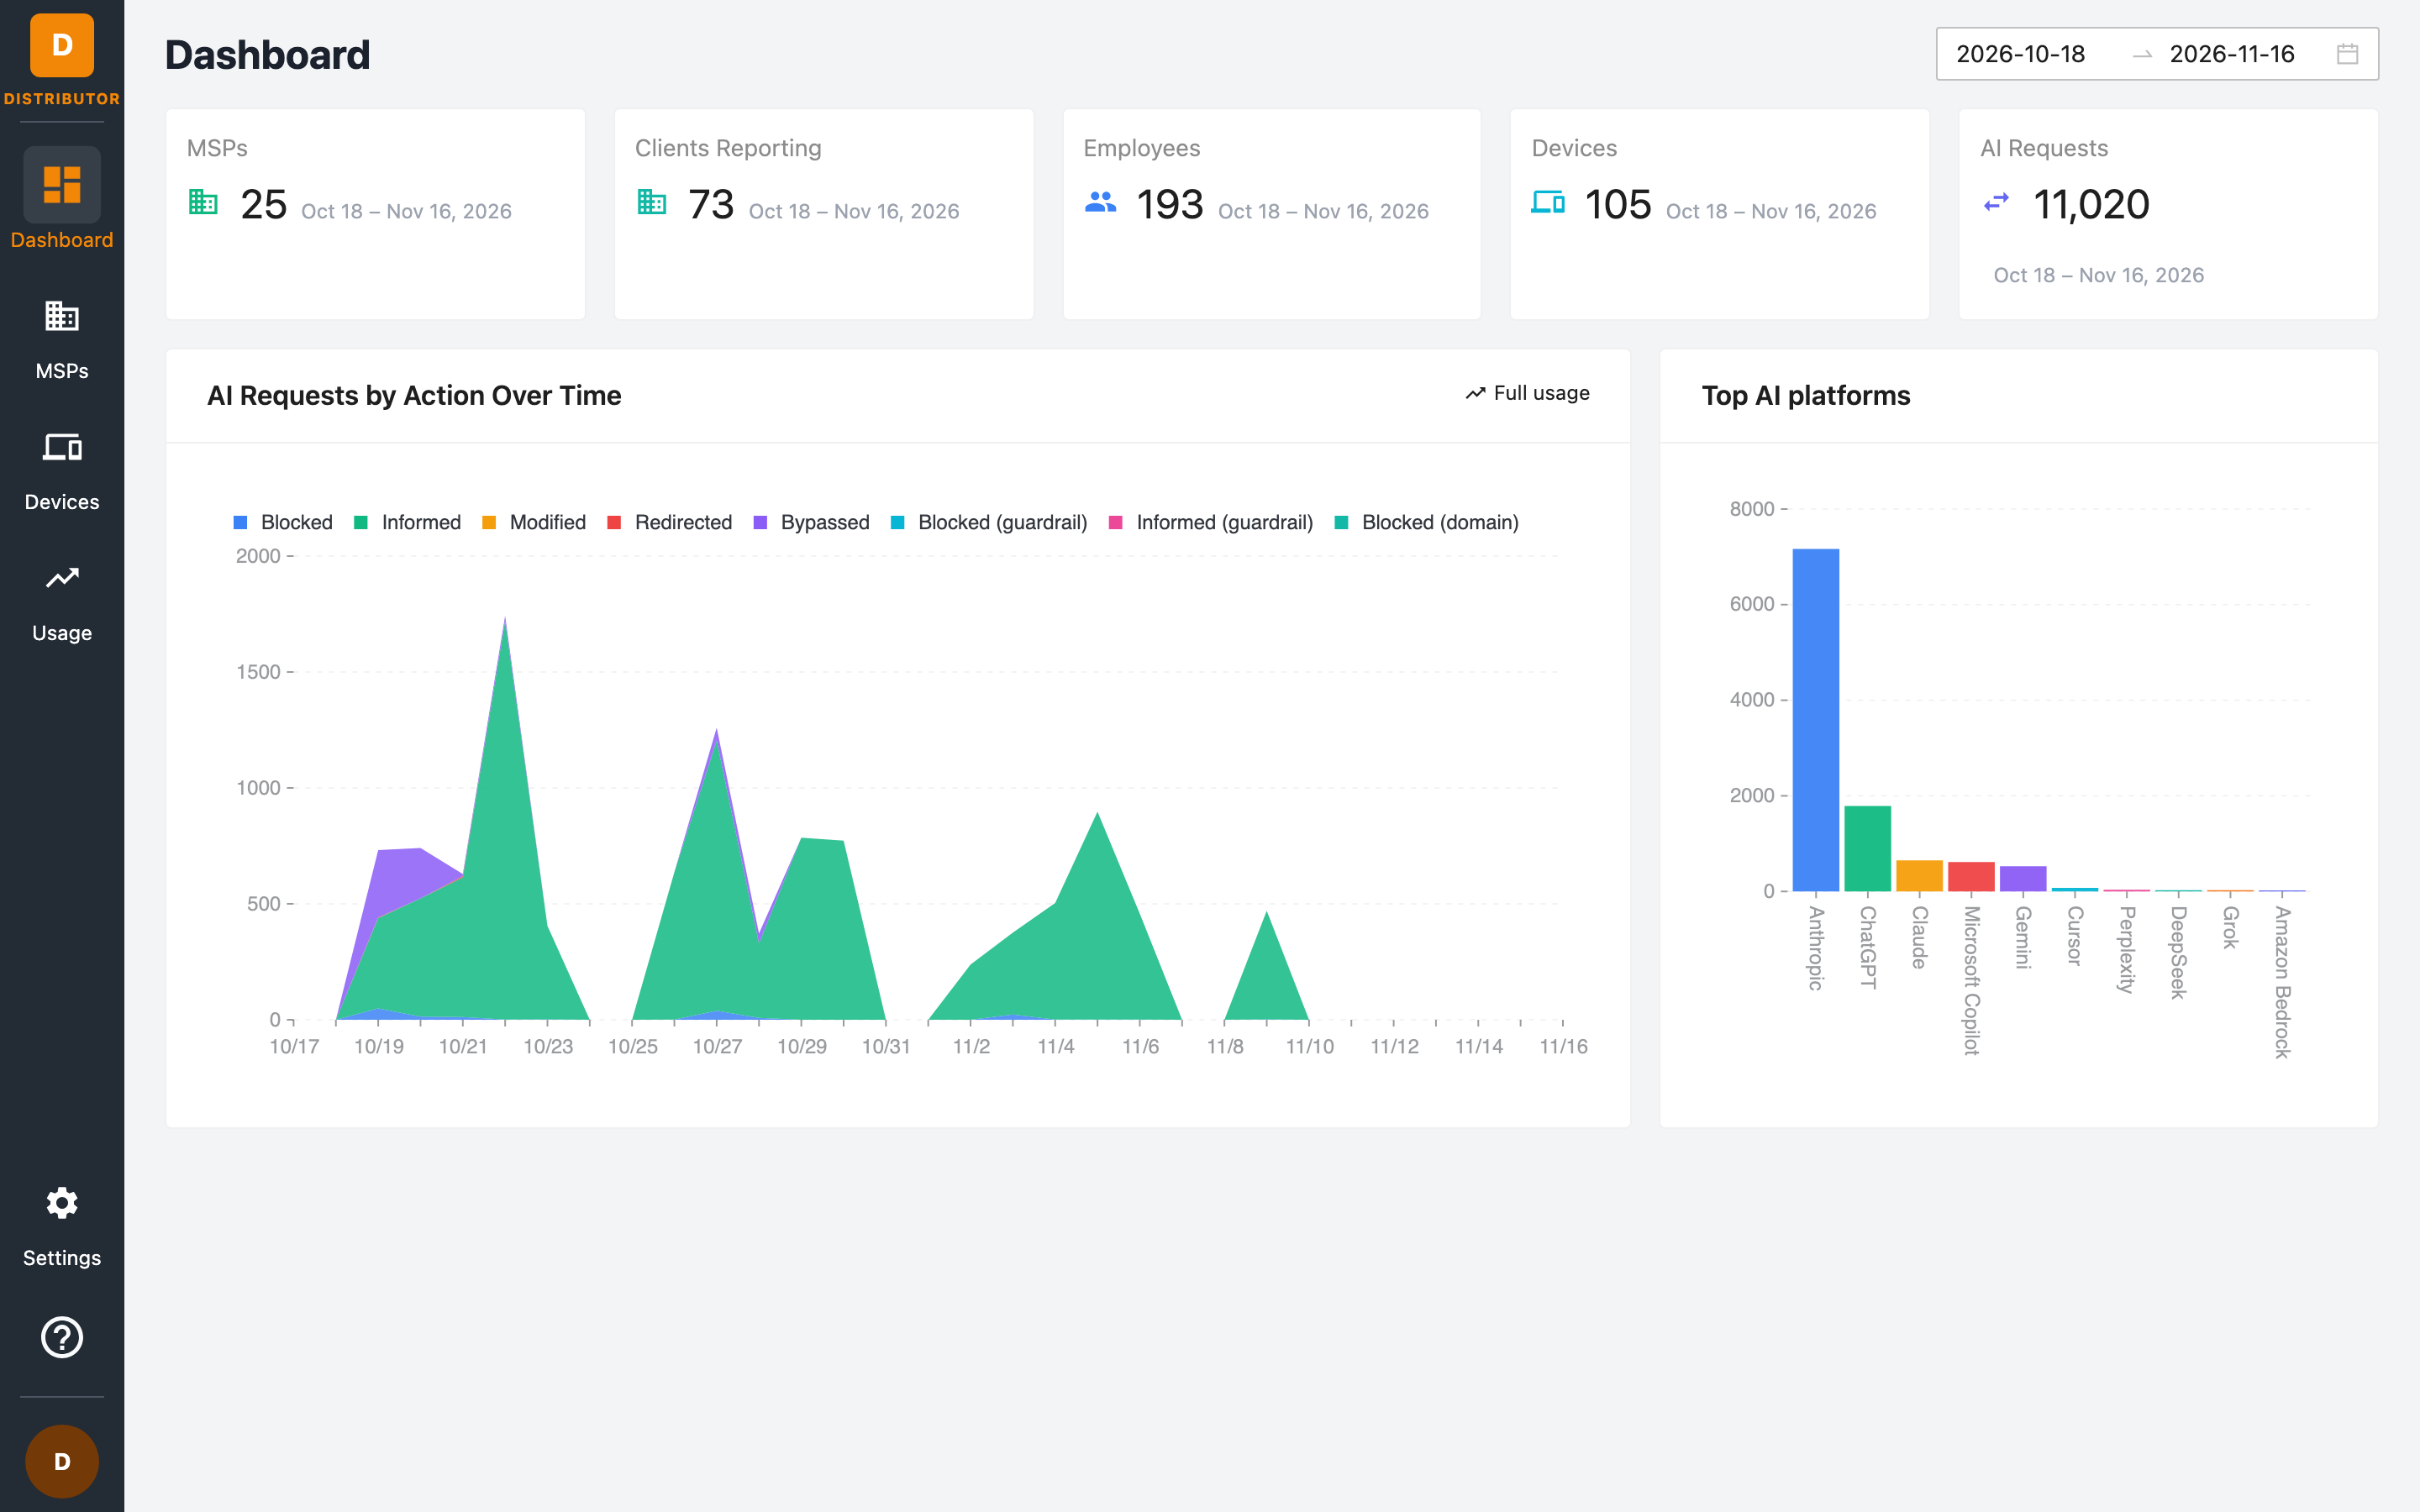
An at-a-glance view of MSPs, clients, employees, devices and AI requests across your distributorship.
The Dashboard is the landing page of the Distributor Portal. It summarises activity from every MSP, and every client beneath them, for the selected date range.
Date range
Use the date picker in the top-right corner to choose the start and end dates. Every card and chart on the page follows it; the default is the last 30 days.
Summary cards
| Card | Meaning |
|---|---|
| MSPs | MSPs under your distributorship. |
| Clients Reporting | Client workspaces that sent data in the period. |
| Employees | Unique employees observed across all clients in the period. |
| Devices | Unique devices reporting in the period. |
| AI Requests | AI requests made by employees in the period. |
Charts
- AI Requests by Action Over Time — AI requests per day, stacked by the action taken: Blocked, Informed, Modified, Redirected, Bypassed, Blocked (guardrail), Informed (guardrail) and Blocked (domain). Click Full usage to open the Usage page.
- Top AI platforms — the AI platforms with the most requests in the period.
For license usage, per-MSP and per-client breakdowns, CSV exports and monthly reports, see Usage.