

Monitoring
Monthly Reports
Updated: November 19, 2026
Generate a monthly AI usage and risk report for any of your MSPs' clients, ready to turn into a customer-facing report.
Monthly reports give you one CSV per client for a calendar month, covering AI adoption, token use, policy and guardrail outcomes, devices, and live policies. Each report covers one MSP and comes as a single Zip. Use them to help your MSPs show clients the value FireTail delivers, point out real risk, and turn trials into paying customers.
These are the same reports each MSP sees in its own portal: a report you generate for an MSP appears on that MSP's Monthly Reports tab too, and reports the MSP generates appear here.
Every Zip also contains a ready-made AI prompt. It turns a client's CSV into a one-page report that can be sent to that customer.
Open monthly reports
Go to Usage in the sidebar and open the Monthly Reports tab. The tab lists the reports generated for the MSPs you can see, newest first. Use the MSP selector above the table to show one MSP's reports.
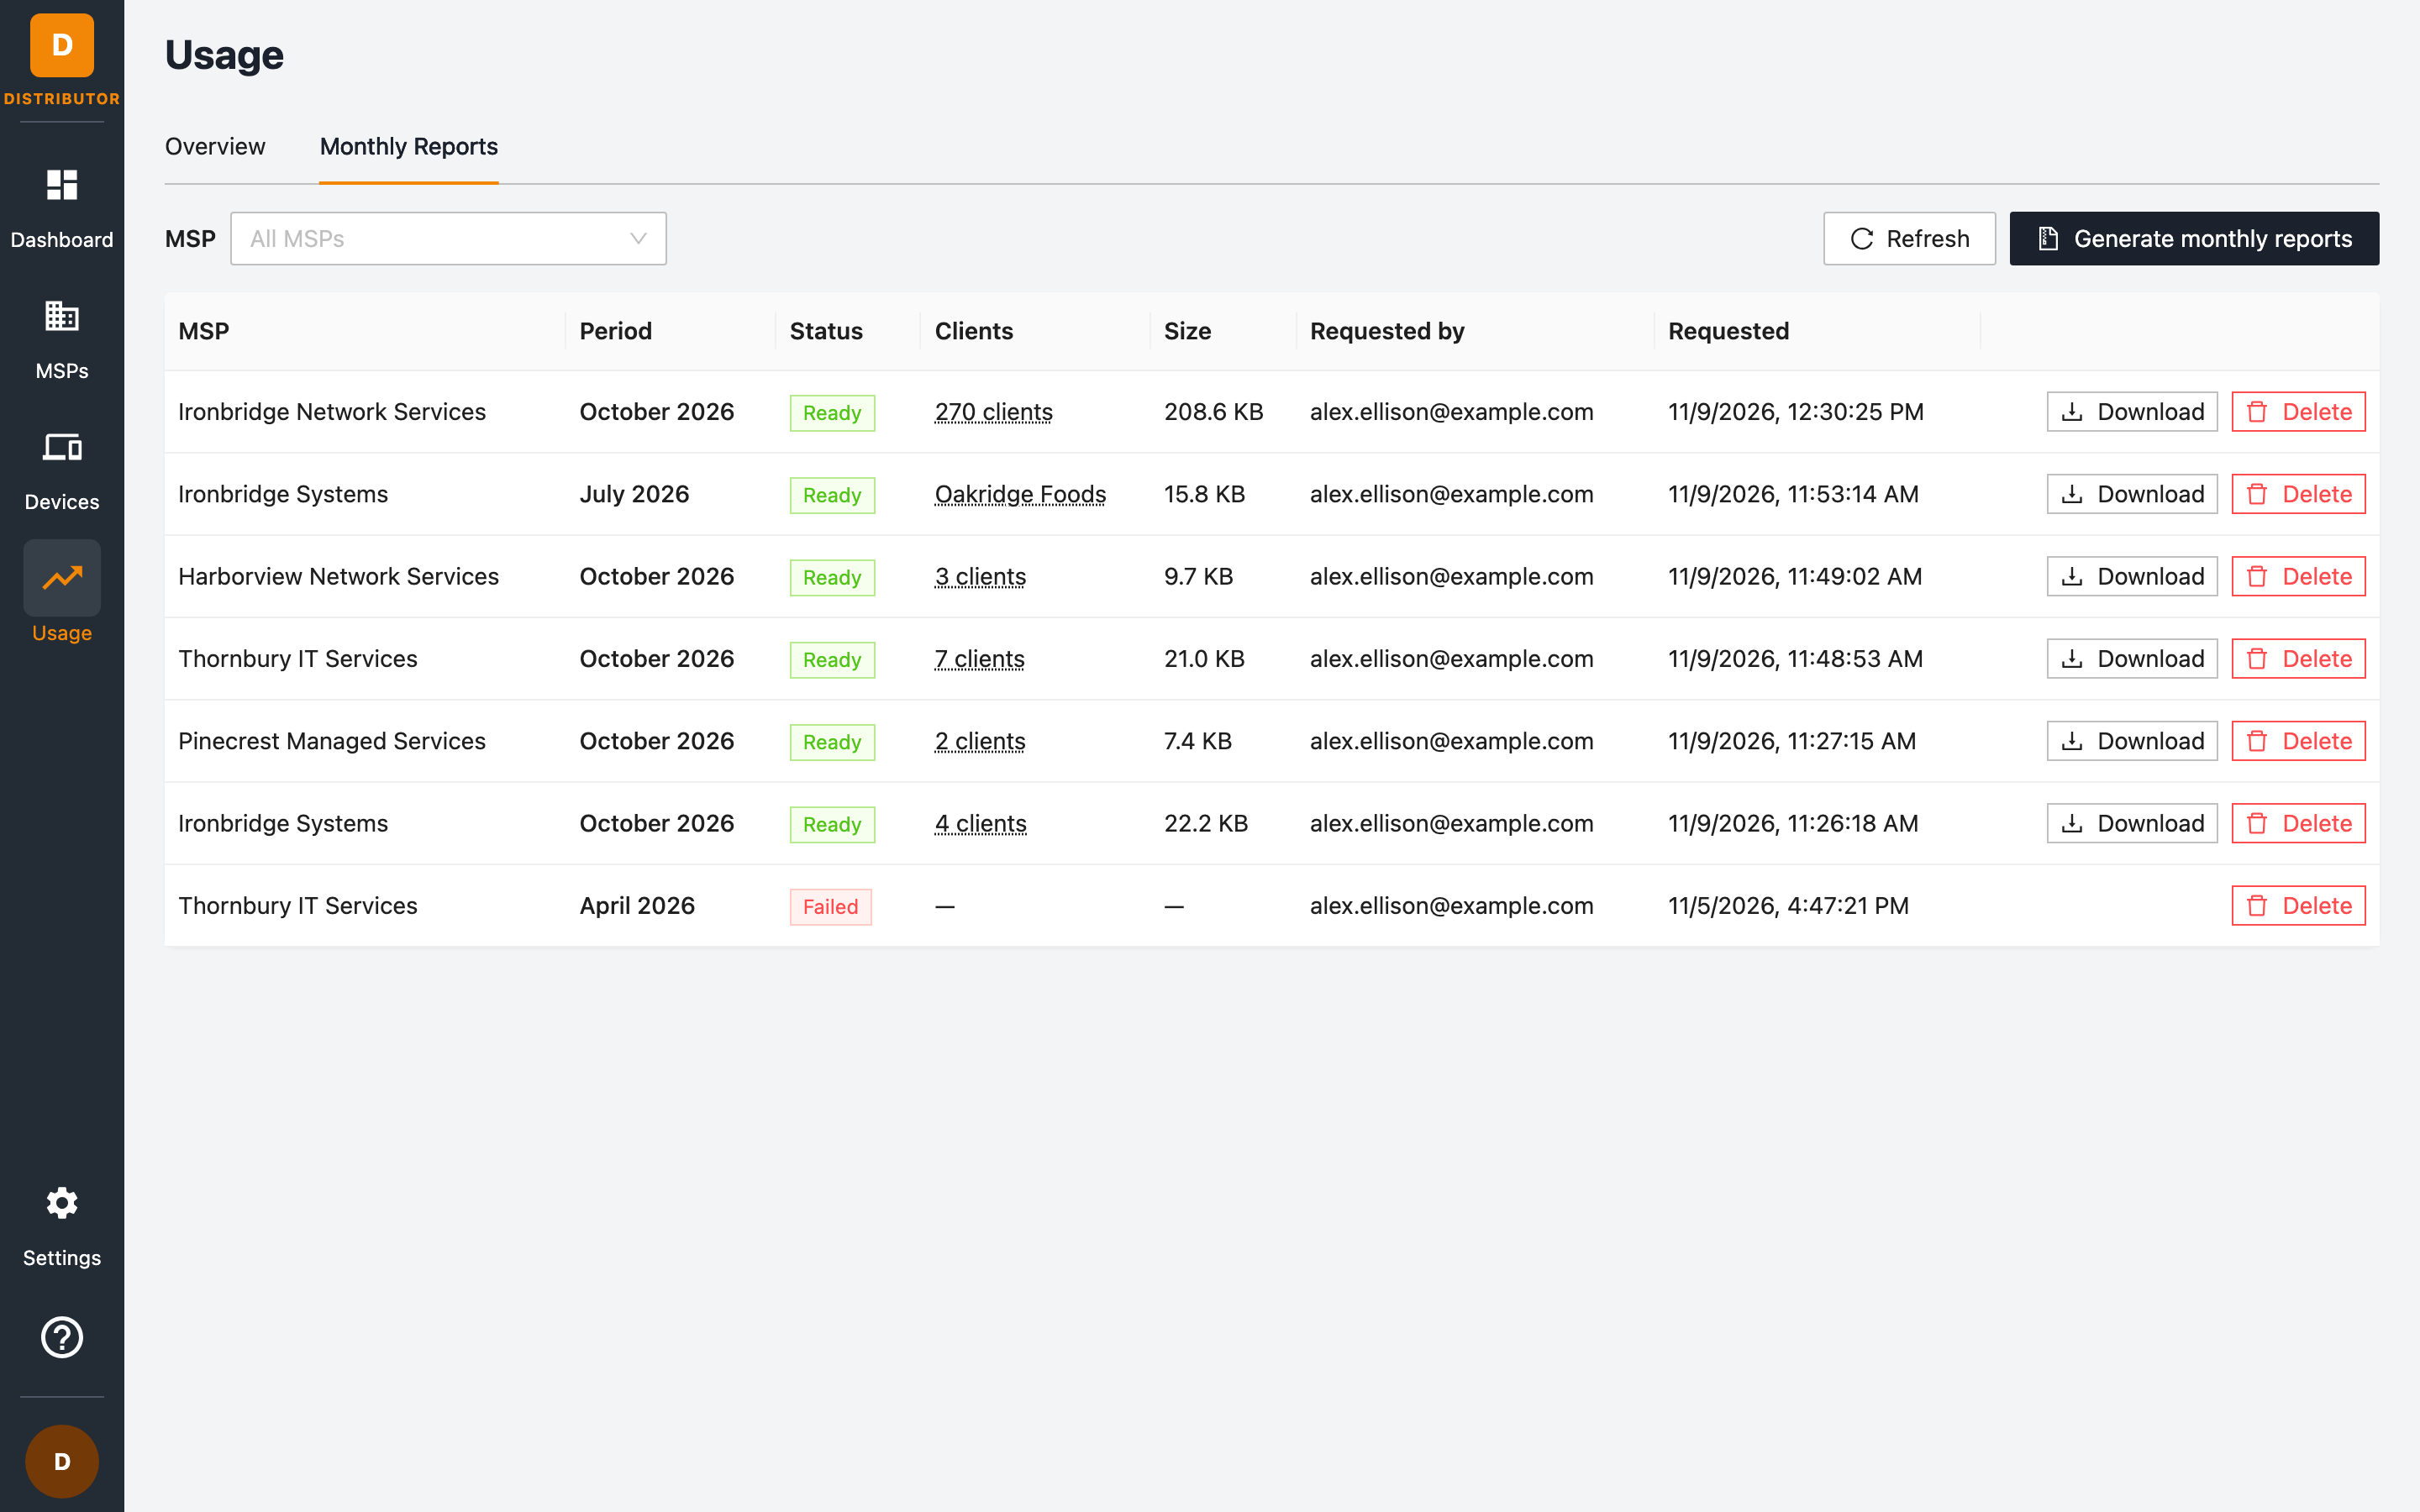
| Column | Meaning |
|---|---|
| MSP | The MSP the report covers. |
| Period | The calendar month the report covers. |
| Status | Queued, Generating, Ready, Failed, or Expired. Hover over Failed to see why. |
| Clients | The clients in the report. Hover over the count to see their names. |
| Size | The size of the Zip file. |
| Requested by | The user who generated the report, in your portal or the MSP's. |
| Requested | When the report was requested. |
If you're in a group, you only see the MSPs, and their reports, in your groups.
Generate a report
- Click Generate monthly reports. The button is on the Monthly Reports tab and also at the top of the Usage Overview tab.
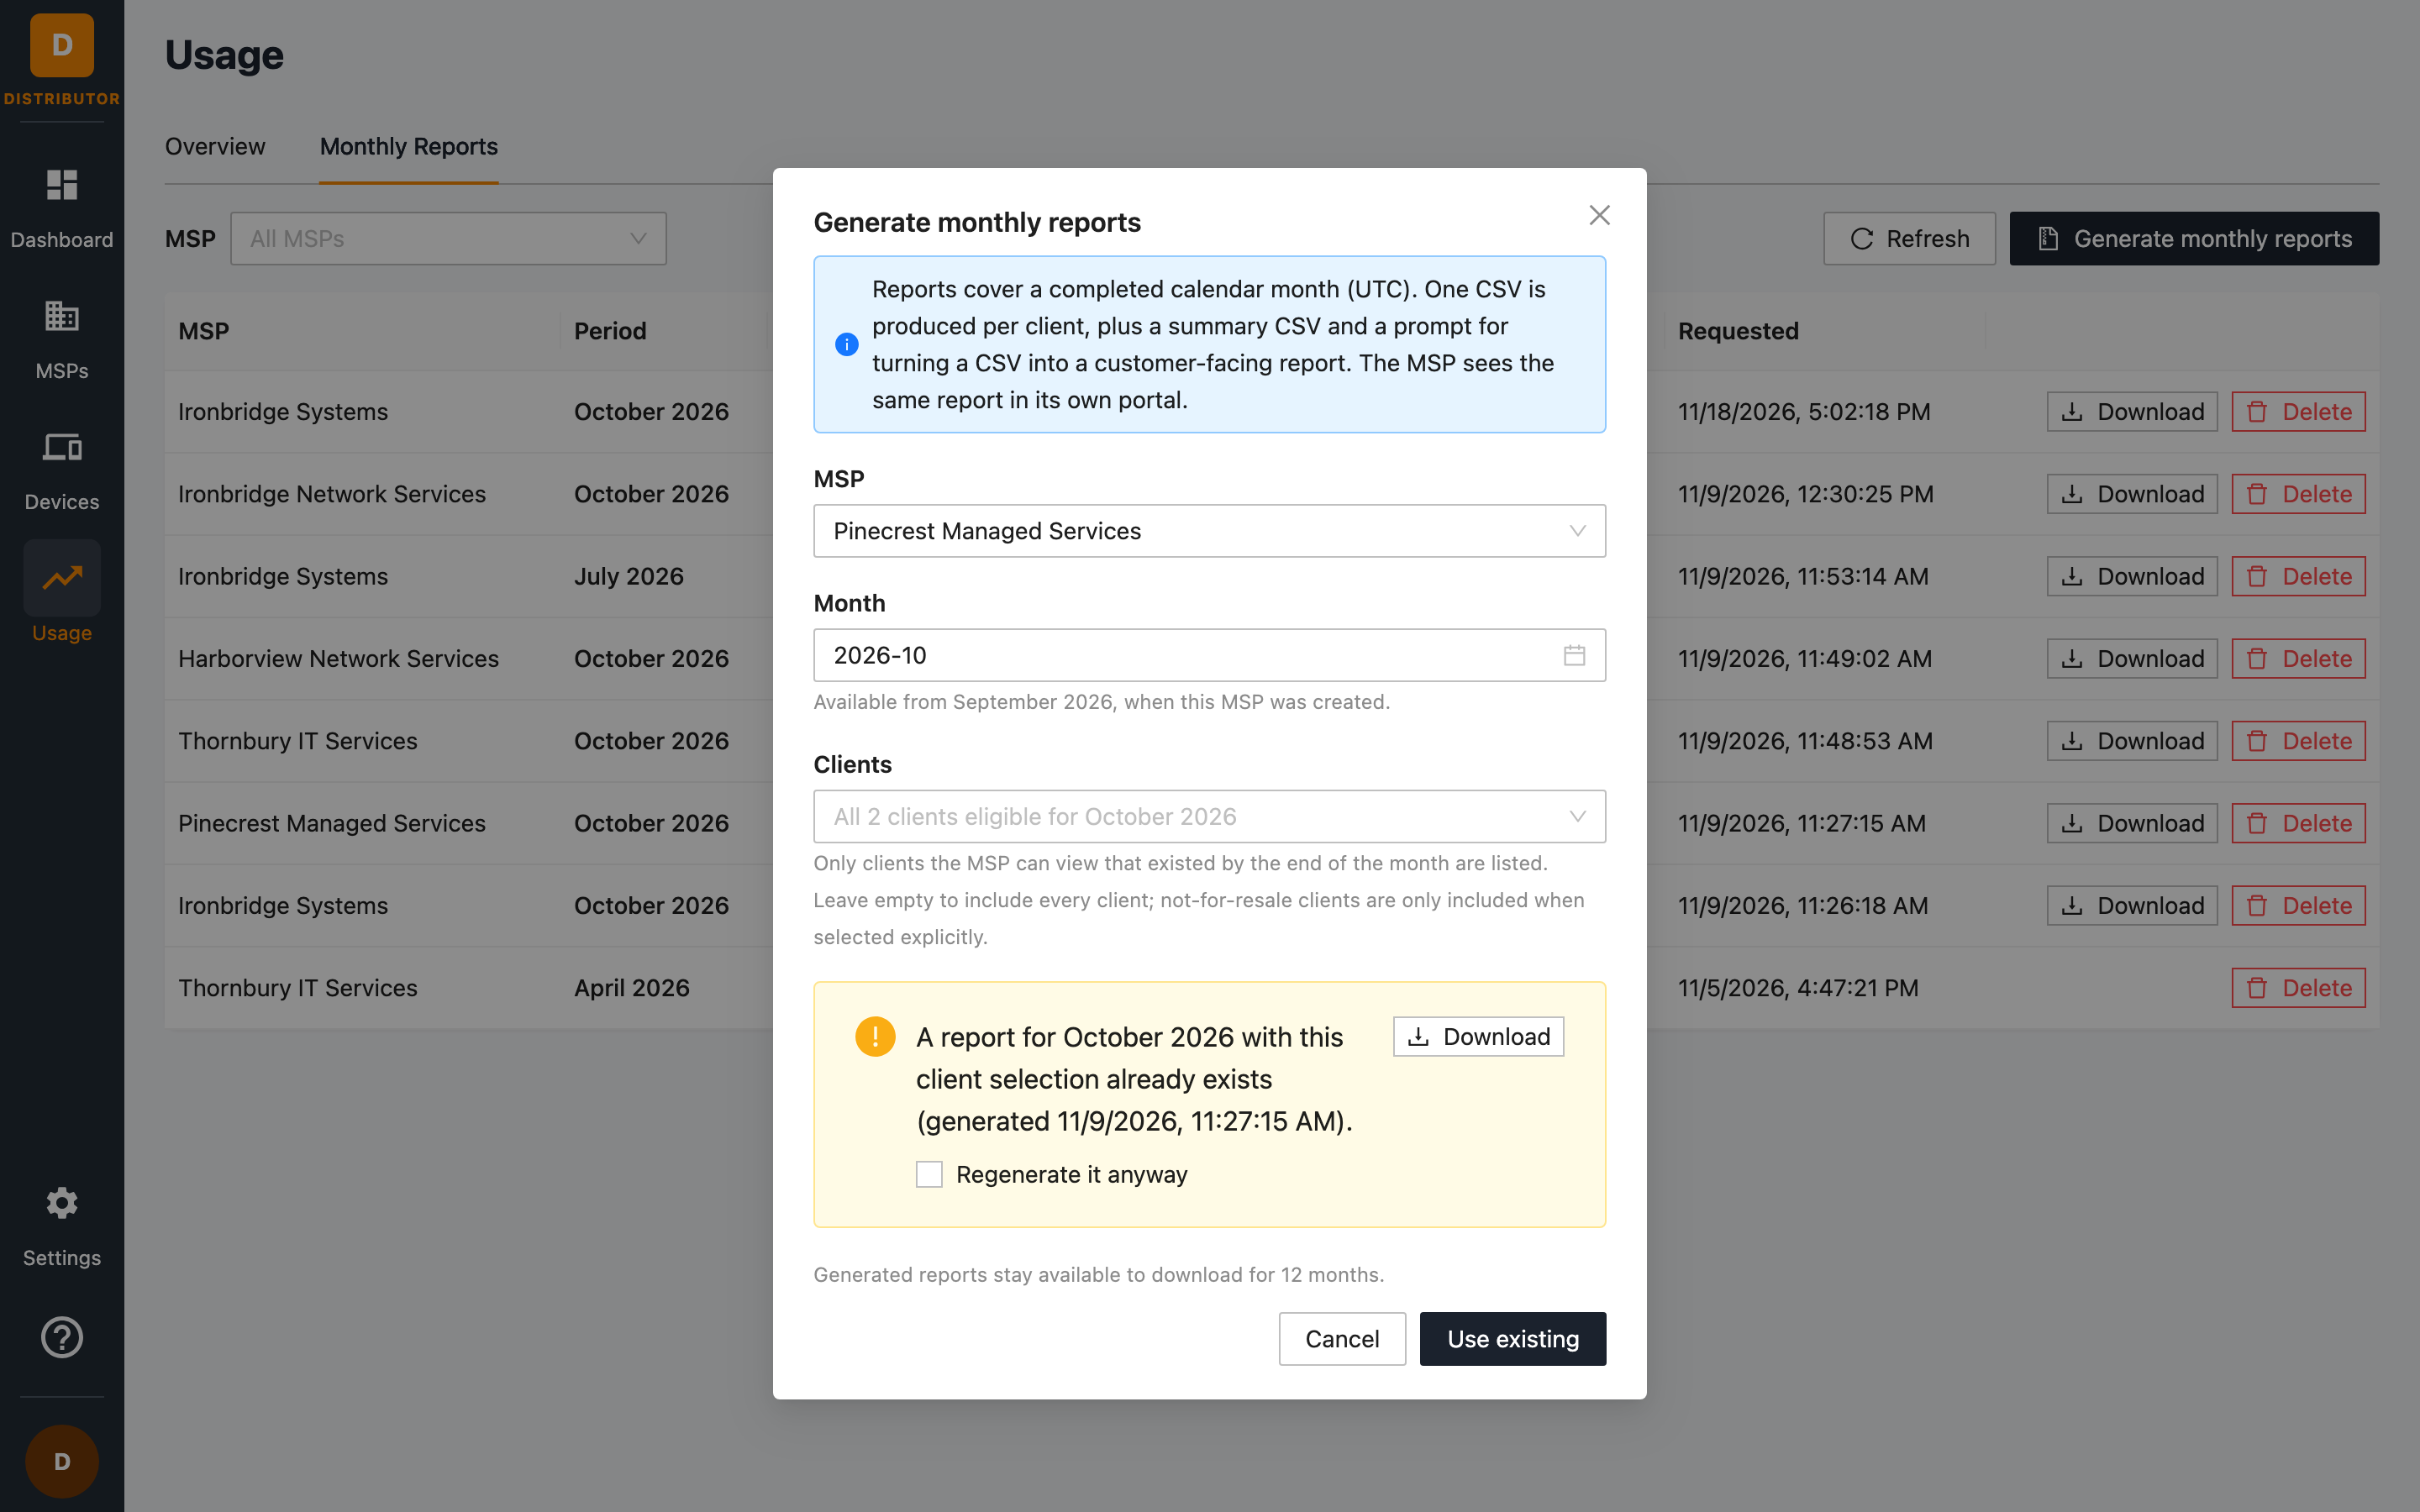
- Choose the MSP. If you filtered the list to one MSP, it's already selected. A suspended MSP must be reactivated before you can generate its reports.
- Choose the Month. Only completed months are available, starting from the month the MSP was created. The current month can't be chosen until it ends.
- Optionally choose the Clients to include. Leave the field empty to include every eligible client.
- Click Generate.
Generation runs in the background and usually takes a minute or two. You can leave the page; the status changes from Generating to Ready when it's done. Click Refresh to check for changes sooner.
Which clients are included
The client list shows only the clients the report can include for that month:
- clients the MSP can view (they grant the MSP read-only or admin access),
- clients that existed by the end of the month, and
- clients that haven't been deleted.
NFR clients (not for resale) are marked (NFR) and left out unless you select them yourself.
If a report already exists
If a report for the same MSP, month, and clients is still available, generated by you or by the MSP, the dialog says so. You can:
- click Use existing (or Download) to download the report that's already there, or
- tick Regenerate it anyway and click Generate to build a new one with the latest data.
Download, keep, and delete reports
- Download: saves the Zip. Hover over the button to see the date the report is available until.
- Delete: removes the Zip permanently, for the MSP too. You or the MSP can generate the month again later.
Reports stay available to download for 12 months after they are generated. After that the status shows Expired, and the month needs to be generated again if you still want it.
What's in the Zip
The Zip is named after the MSP and the month, for example Acme-IT-Services-October-2026.zip:
Acme-IT-Services-October-2026.zip
├── 00-SUMMARY-Acme-IT-Services-October-2026.csv
├── clients/
│   ├── Globex/Globex-October-2026.csv
│   └── Initech/Initech-October-2026.csv
├── README.txt
└── CUSTOMER-REPORT-PROMPT.md
| File | Contents |
|---|---|
| Summary CSV | One row per client with the month's headline numbers and the path to that client's CSV. Useful for comparing clients or for billing. |
| Client CSVs | One detailed CSV per client, each in its own folder, so you can hand a single folder to that client. |
| README.txt | The report period, column definitions, every section explained, and notes on the data. |
| CUSTOMER-REPORT-PROMPT.md | A prompt for turning a client CSV into a customer-facing report with an AI assistant. |
The CSVs are UTF-8 and open directly in Excel, Google Sheets, or Numbers.
Summary CSV columns
| Column | Meaning |
|---|---|
client_name, client_uuid |
The client. |
period |
The month, as YYYY-MM. |
report_file |
The path to the client's CSV inside the Zip. |
active_users_peak |
The highest number of active AI workforce users on any day. |
employees_total, new_employees |
Employees in the AI workforce product, and how many were added this month. |
total_logs |
AI prompts and interactions FireTail captured. |
platforms_count |
How many AI platforms were used. |
active_policies_peak, msp_policies_assigned |
The highest number of active workforce policies, and how many of the MSP's policies apply to the client. |
devices_peak |
The highest number of active devices on any day. |
blocked_requests, guardrail_requests |
Requests blocked by policy, and requests a guardrail blocked or informed on. |
input_tokens, output_tokens, total_tokens |
AI tokens used. |
Client CSV sections
Each client CSV uses the same six columns: section, metric, dimension, date, value, and notes. Rows are grouped into sections, so you can filter on section to chart one series at a time.
| Section | What it shows |
|---|---|
meta |
The client, the period, when the report was generated, and the report version. |
summary |
The month's headline numbers. |
active_users_by_day |
Peak active AI workforce users per day. |
active_policies_by_day |
Peak active workforce policies per day. |
devices_by_day |
Peak active devices (endpoint agents) per day. |
logs_by_day |
AI prompts and interactions per day. |
logs_by_platform |
Interactions per AI platform for the month, busiest first. |
logs_by_platform_by_day |
Interactions per AI platform per day. |
tokens_by_day |
Input, output, and total tokens per day. |
tokens_by_platform |
Input, output, and total tokens per AI platform. |
requests_by_action |
Requests by outcome: blocked, informed, modified, redirected, bypassed, blocked or informed by a guardrail, and blocked by domain. |
platforms_by_action |
The same outcomes broken down by AI platform. |
new_employees_by_day |
Employees added to the AI workforce product per day. |
policies_live |
The MSP's workforce policies that are enabled and assigned to the client when the report is generated. |
Daily sections include every day of the month. Days with no activity show 0.
Turn a CSV into a customer report
You or the MSP can open CUSTOMER-REPORT-PROMPT.md, paste the prompt into your AI assistant, and attach or paste one client's CSV. You get a one-page report for a business decision maker at the client, with these parts:
- Executive summary: adoption, the main risk signal, and one recommended action.
- AI adoption: active users, new employees, interactions, tokens, and the platforms in use.
- Risk exposure: blocked requests, guardrail activity, and unexpected platforms.
- Policy coverage: the live policies and any gaps.
- Recommendations: concrete next steps for the coming month.
- Appendix: the headline numbers.
The prompt tells the assistant to use only the numbers in the CSV. Still, review the output before you send it, and edit the prompt to match the branding and tone of whoever sends it.
Things to know about the data
- Months are in UTC. A report runs from 00:00 UTC on the 1st to the end of the month's last day, UTC.
- Totals can differ slightly from the Usage page. The Usage page uses rolled-up metrics and your browser's time zone.
- Output tokens are recorded only where the AI platform reports them, so
total_tokenscan equalinput_tokensfor some platforms. - Live policies are the policies at the time the report is generated, not at the end of the month. They include only policies the MSP manages.
- More sections are coming. Per-employee rankings, file uploads, and topics will be added in later report versions. The
report_versionin themetasection goes up when sections are added.
Permissions
| Permission | Allows |
|---|---|
report:list |
Seeing the Monthly Reports tab and its list. |
report:generate |
Generating reports. |
report:get |
Downloading reports. |
report:delete |
Deleting reports. |
The Admin role includes all four. report:list and report:get are also part of the built-in Read Only role. To give other users access, add these permissions to a custom role. See Roles & Permissions.