

Getting Started
Dashboard
Updated: November 16, 2026
A tour of the MSP dashboard and its headline metrics.
The Dashboard is the landing page of the MSP Portal. It gives you an instant overview of activity across all of your clients.
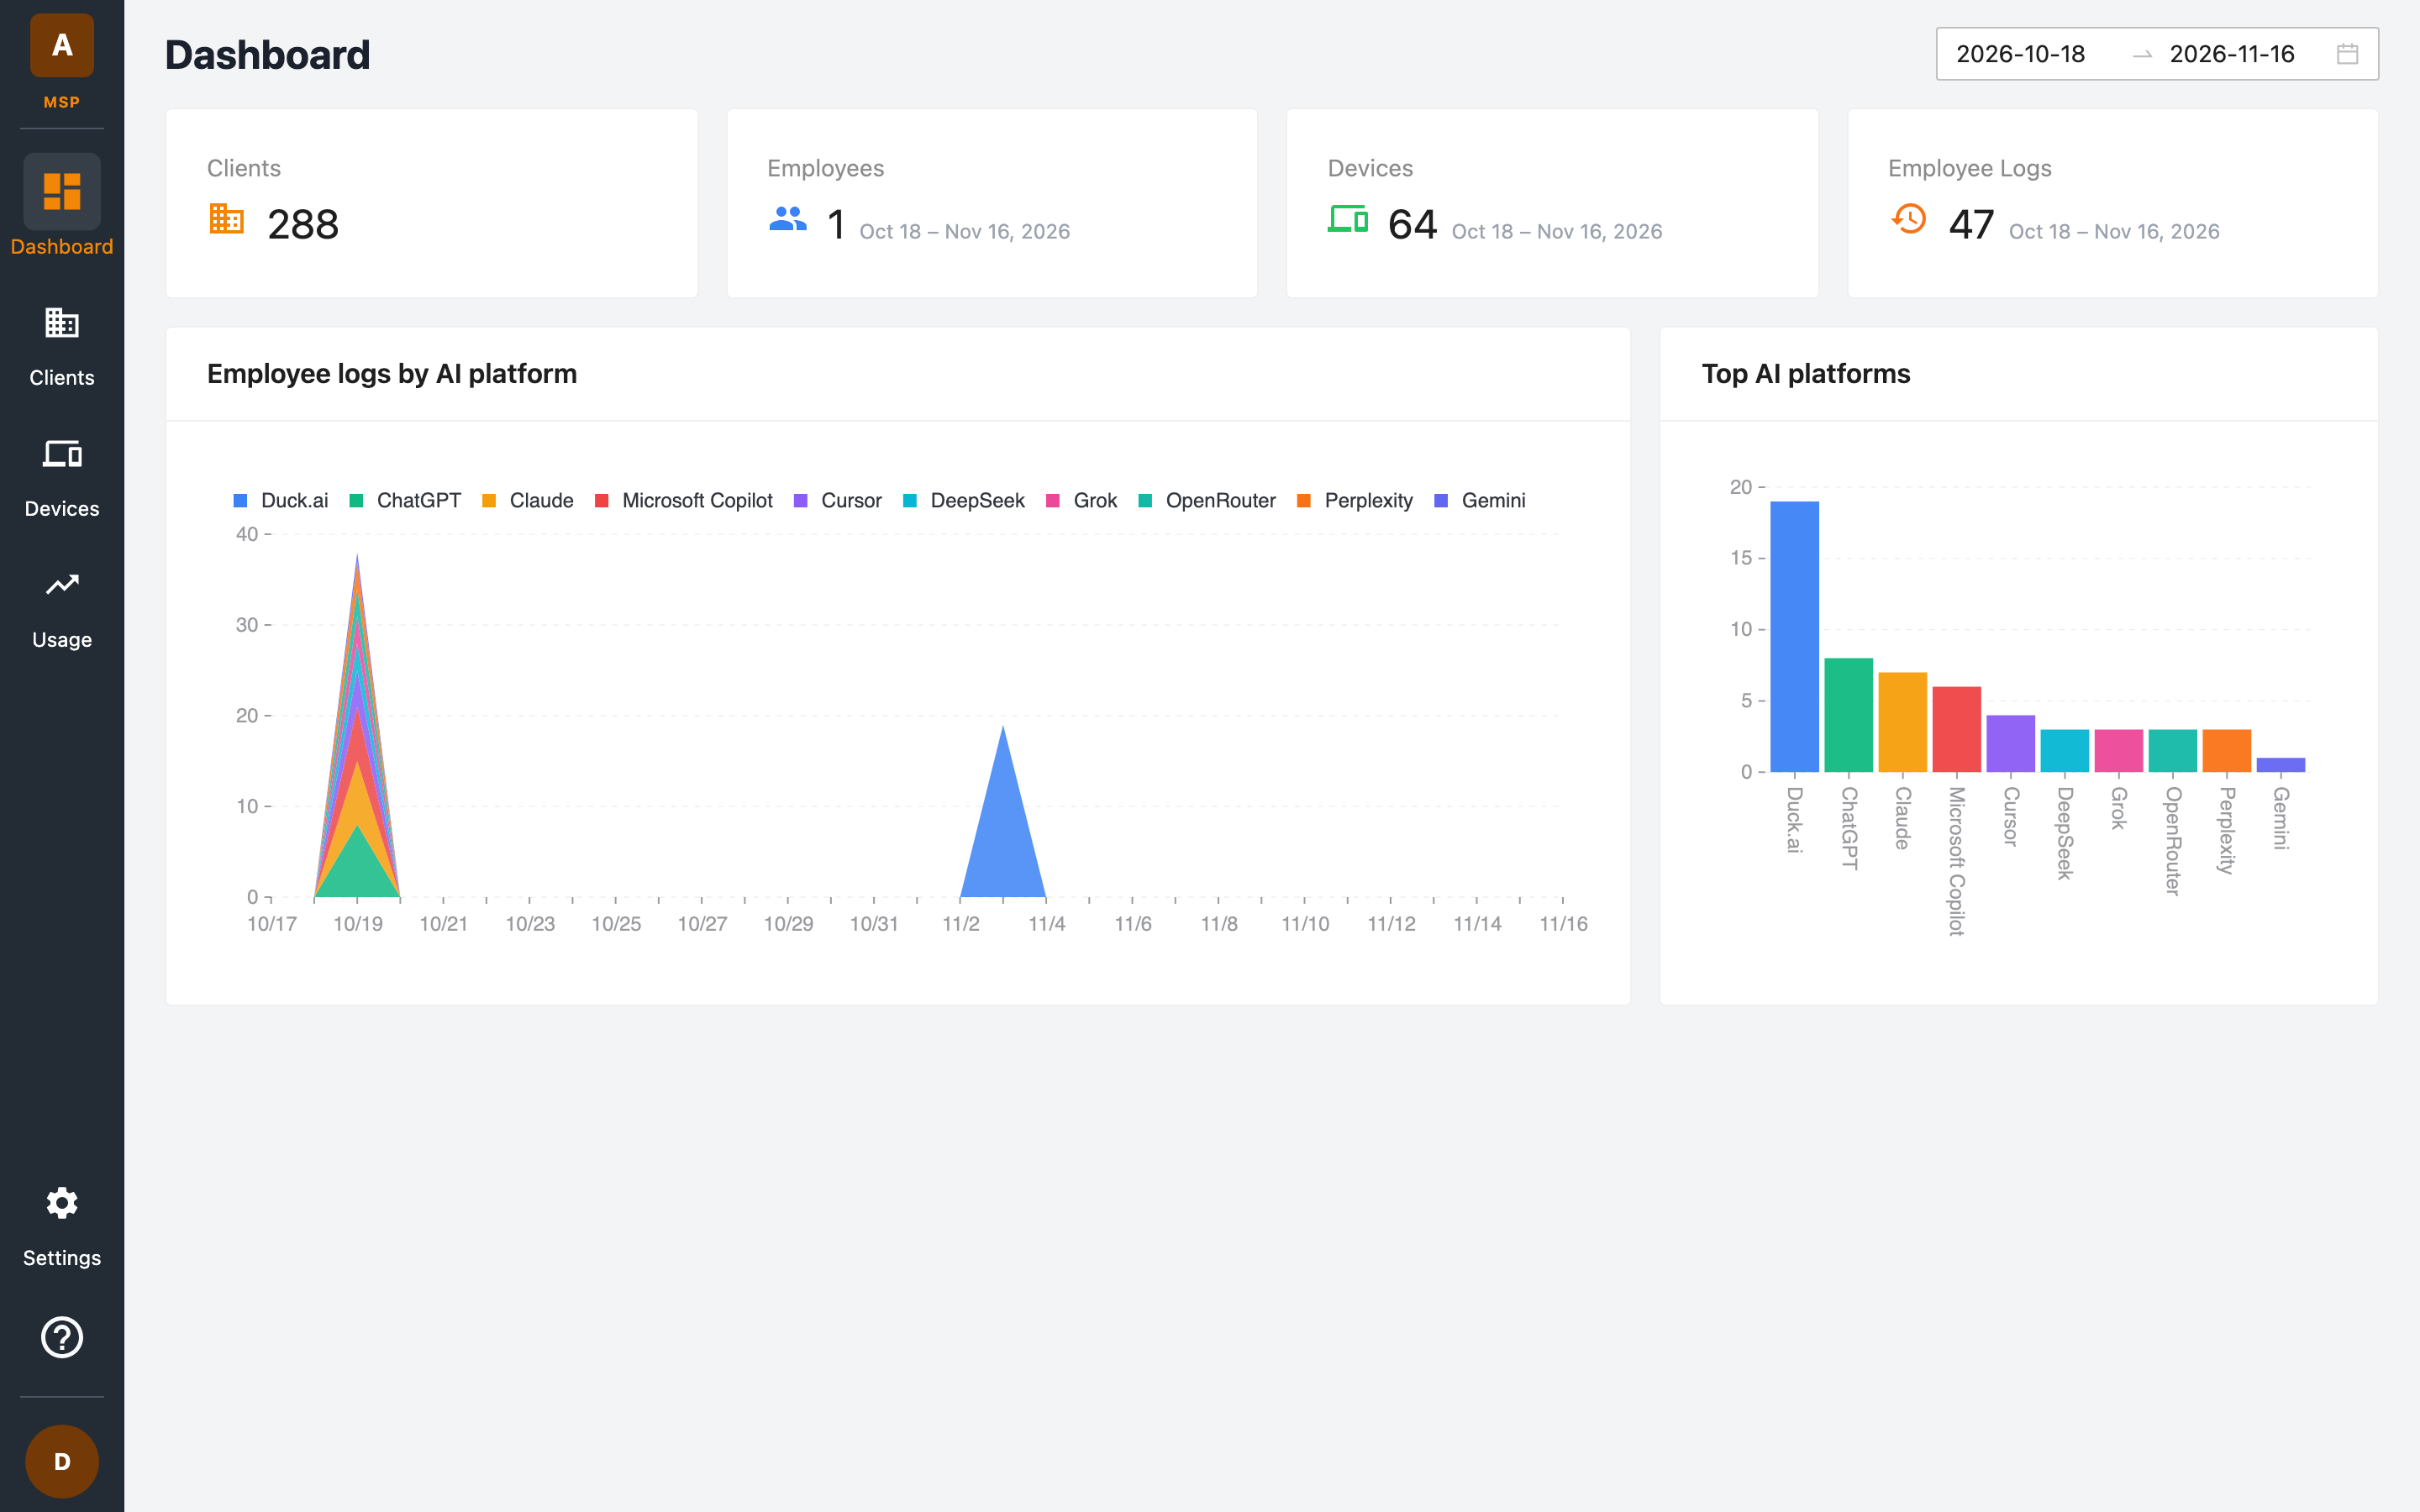
Headline metrics
Four summary cards sit at the top of the dashboard:
| Card | Meaning |
|---|---|
| Clients | The number of client workspaces under your MSP. Click the card to jump to the Clients page. |
| Employees | Employees observed across all clients in the selected date range. |
| Devices | Devices reporting across all clients in the selected date range. |
| Employee Logs | AI activity log events collected across all clients in the selected date range. |
Charts
Below the summary cards you'll find two visualisations:
- Employee logs by AI platform — a time-series view of AI activity, broken down by the AI platform employees are using (for example ChatGPT, Copilot, Gemini).
- Top AI platforms — a ranking of the AI platforms generating the most activity across your client base.
Filtering by date
Use the date range picker in the top-right of the dashboard to choose the period. It opens on the last 30 days. The Employees, Devices, and Employee Logs cards show the selected range beside their figure and change with it, as do both charts. Clients always counts every client workspace.