

Monitoring
Usage & Licensing
Updated: November 16, 2026
Track license usage, activity, and billing metrics across your clients.
The Usage page gives you detailed, per-client reporting on employees, devices, AI requests, and license consumption — the numbers that matter for billing. It has two tabs: Overview and Monthly Reports.
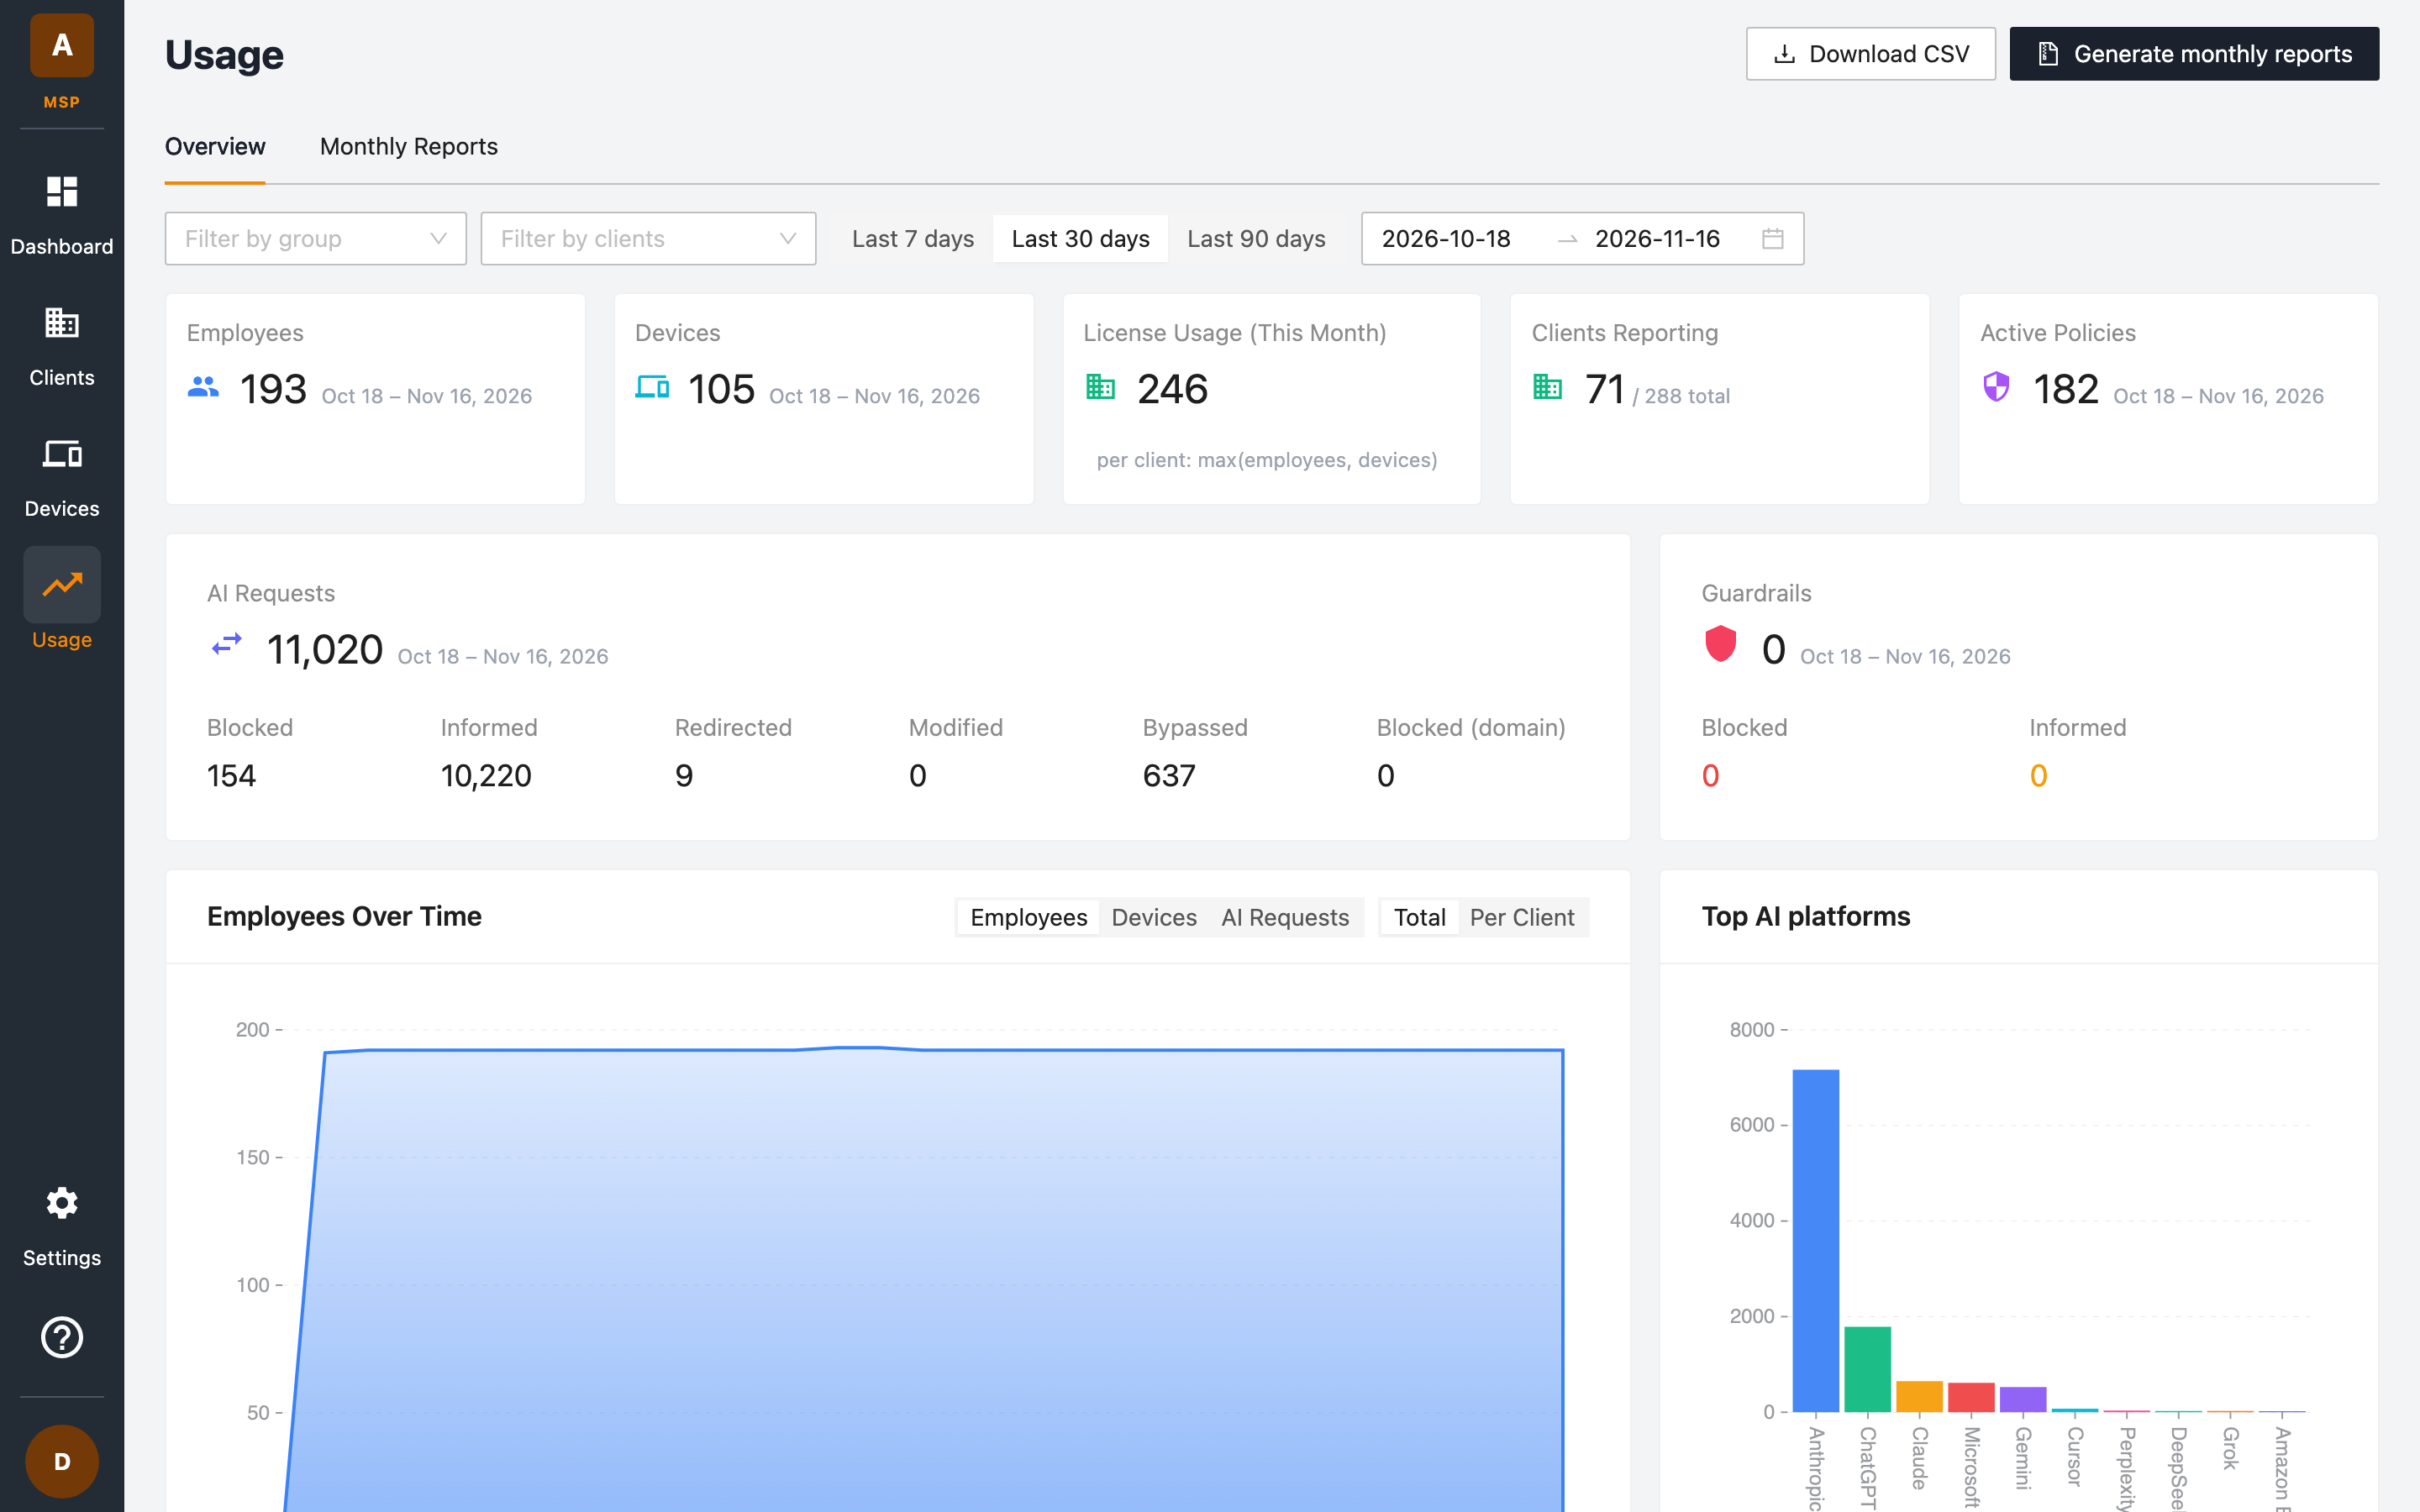
Summary cards
| Card | Meaning |
|---|---|
| Employees | Employees observed in the selected date range. |
| Devices | Devices reporting in the selected date range. |
| License Usage (This Month) | Your billable license count for the current month: each client counts as max(employees, devices). |
| Clients Reporting | How many of your clients sent data in the range (for example 71 / 288 total). |
| Active Policies | The number of active policies across your clients. |
Two wider cards follow:
| Card | Meaning |
|---|---|
| AI Requests | AI requests in the selected date range, split by outcome: Blocked, Informed, Redirected, Modified, Bypassed, and Blocked (domain). |
| Guardrails | Requests in the range that a guardrail Blocked or Informed. |
How license usage is calculated
License usage for a month is the maximum of employees and devices observed in that month. For example, with 66 employees and 25 devices, license usage is 66.
NFR clients (Not For Resale, for example your own internal test workspace) are marked in the Usage by Client table and excluded from license usage totals.
From the API:
GET /msps/<msp-uuid>/licensingreturns the License Usage (This Month) figure (totalLicenseUsage; addperiod=previous_monthfor the whole of last month), with a per-client breakdown — see API Access. It needs thebilling:getpermission and always counts every client, including clients that have revoked your data access, so it can be higher than the card. The API calculates the month in UTC (from 00:00 UTC on the 1st, as reported inperiodStart), so for the first hours of a month it can differ from the card, which uses your browser's local time.
Filters
At the top of the Overview tab you can shape the report:
- Filter by group — restrict to clients in a specific group.
- Filter by clients — restrict to one or more specific clients. Choosing a group clears this filter.
- Last 7 days, Last 30 days, Last 90 days — quick date ranges.
- Date range — pick any start and end date.
Charts
The Over Time chart can plot Employees, Devices, or AI Requests, either as a Total across all selected clients or Per Client as separate series. Each point is one day.
Top AI platforms ranks the AI platforms with the most activity in the range.
Usage by Client table
The Usage by Client table breaks the numbers down per client. Its columns — Employees, Devices, License Usage, AI Requests and its outcomes, and guardrail counts — are sortable.
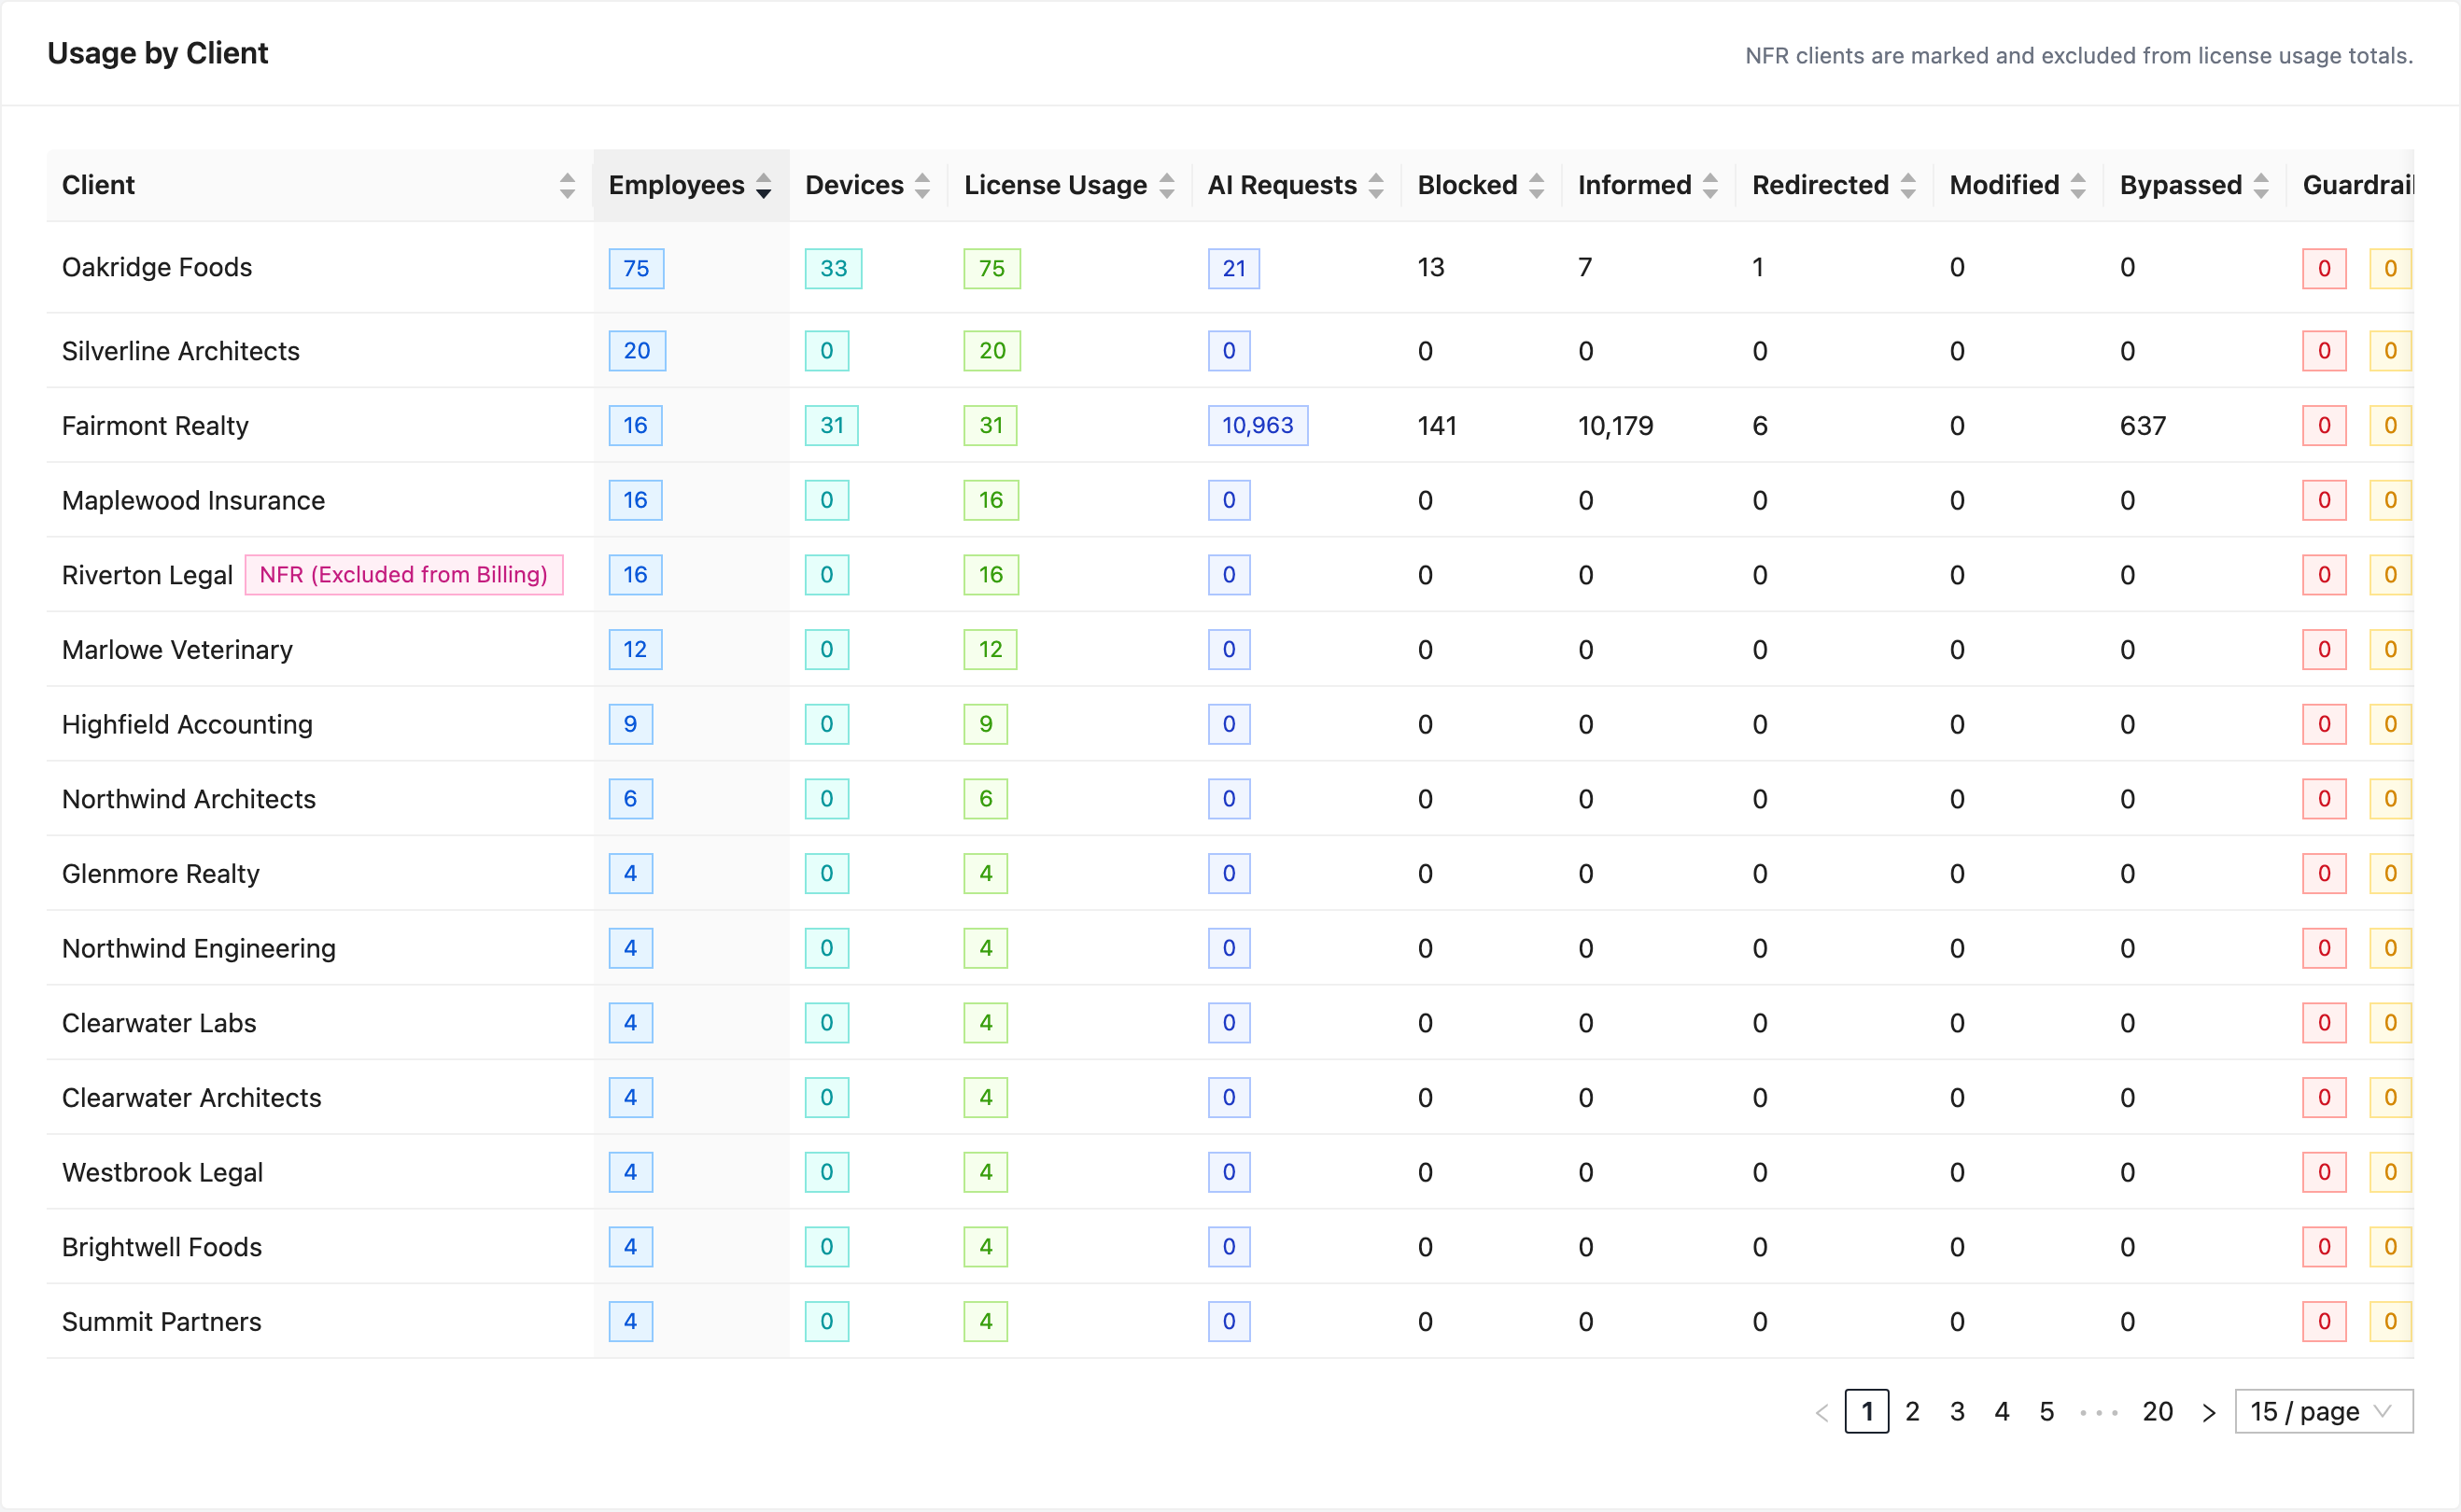
NFR clients are labelled with an NFR (Excluded from Billing) badge so you can see them in the breakdown while knowing they don't count toward your license totals.
Exporting for billing
Click Download CSV to export the current view — including your filters and date range — as a CSV file for invoicing or further analysis.
Monthly reports
Open the Monthly Reports tab for the reports generated for your MSP.
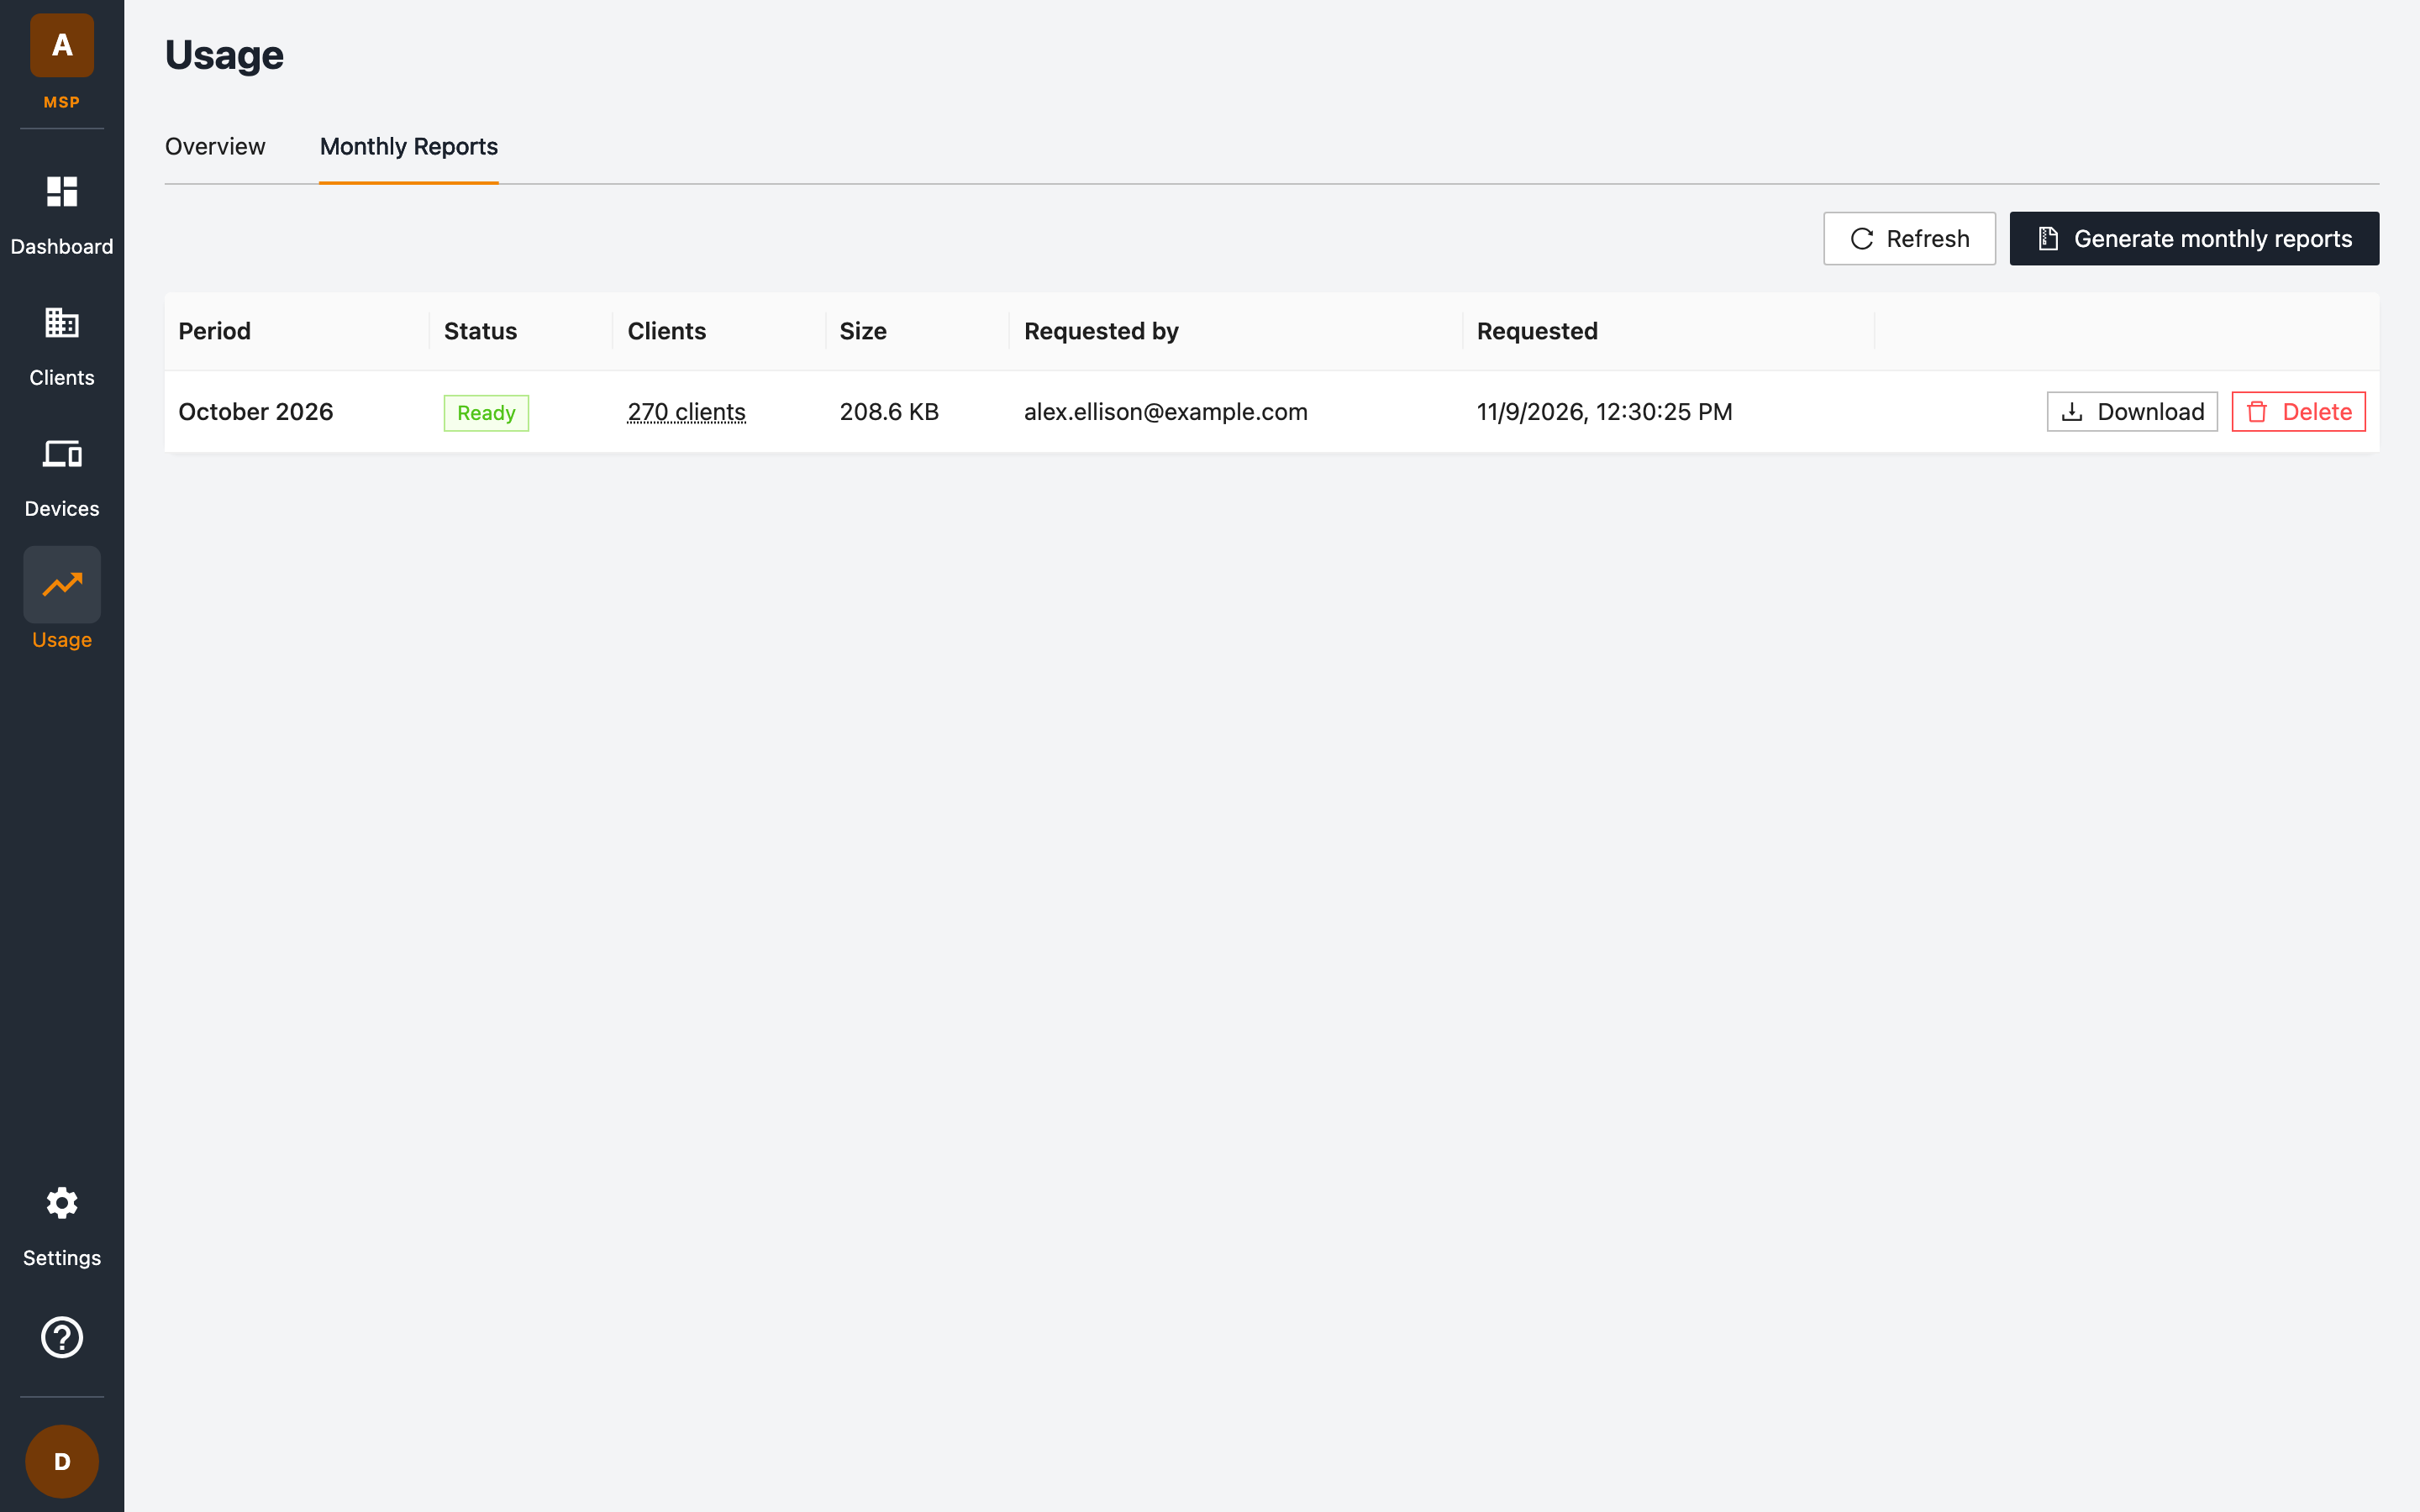
Click Generate monthly reports, choose the month and the clients to include, and confirm. The tab lists each report's Period, Status, the Clients it covers, its Size, and who requested it and when. Use Refresh to update the status of a report that is still being generated, Download to save a finished one, and Delete to remove it.
Reports stay available to download for a limited time after they are generated; the retention period is shown in the tab. Generate the month again if you still need it. If a report for the same month and client selection already exists, you can download it or tick Regenerate it anyway.
Viewing this tab requires permission to list reports.
Guardrail activity
The Guardrail activity section, below the Usage by Client table on the Overview tab, shows the guardrails evaluated in your clients' requests. It follows the date, client and group filters at the top of the page. You can also filter by platform, guardrail and outcome, and Download CSV.
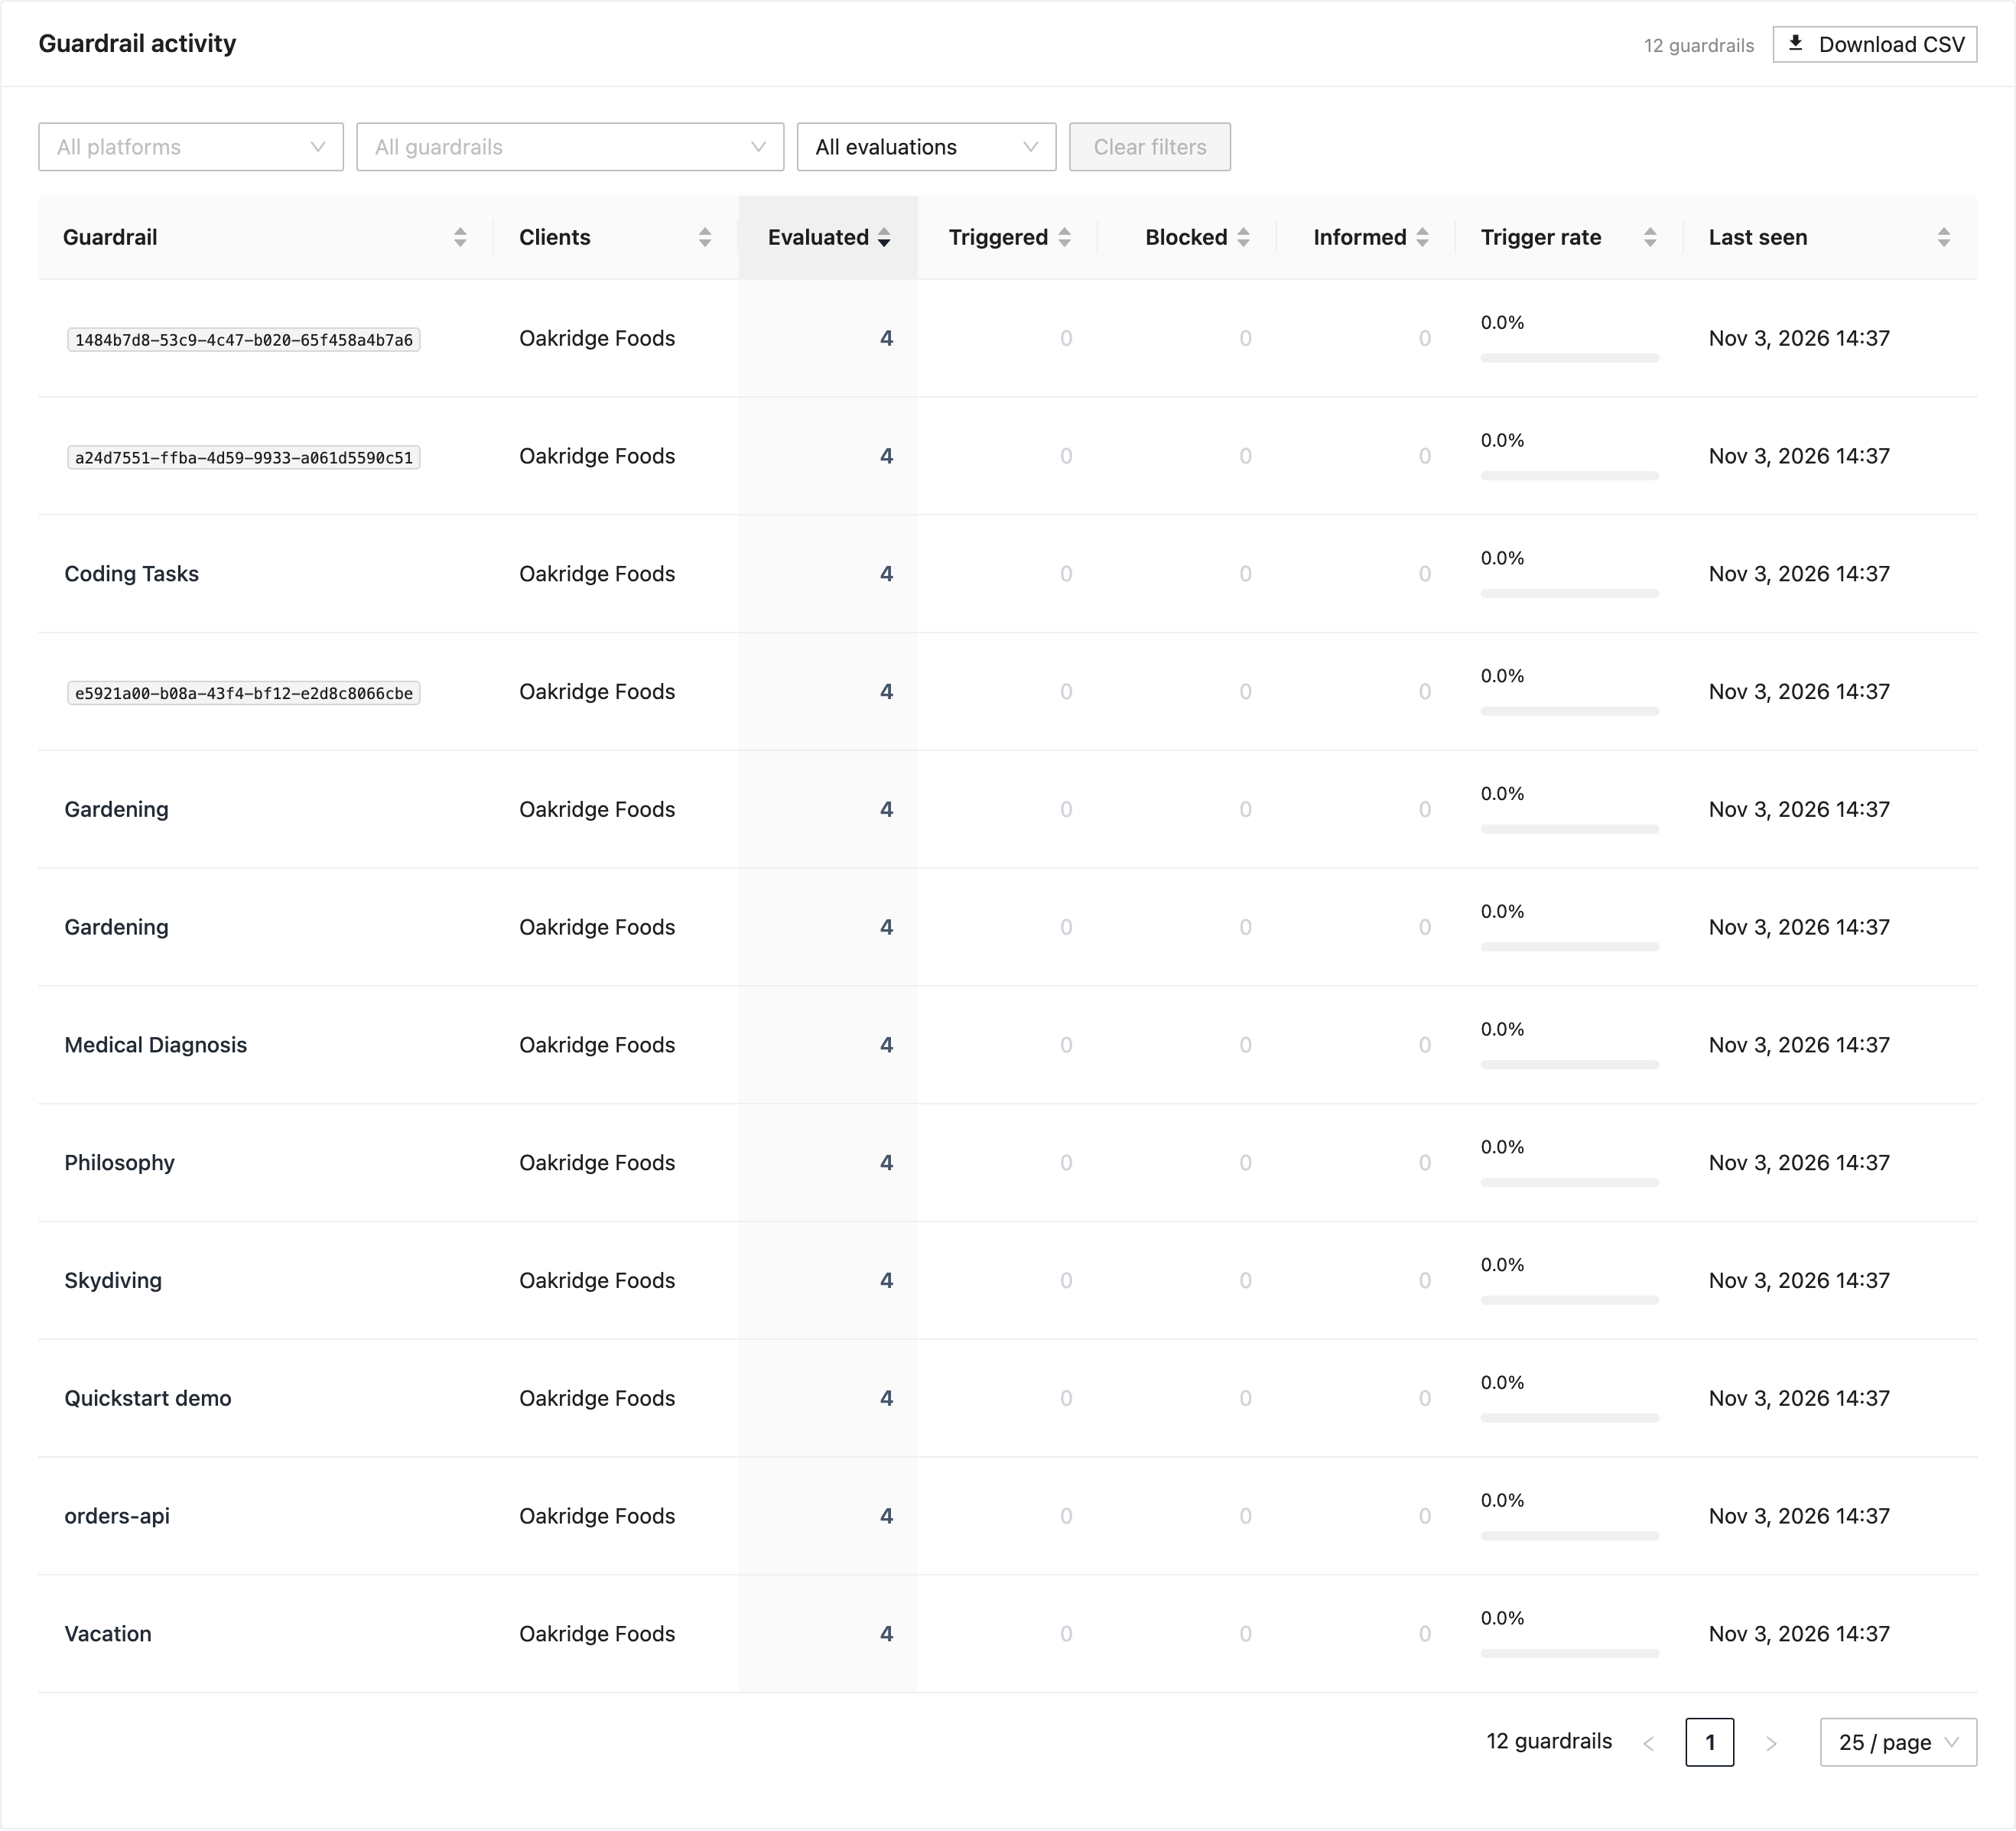
| Column | Meaning |
|---|---|
| Evaluated | Requests evaluated by this guardrail, counted once per request. |
| Triggered | Requests this guardrail matched — it either blocked the request or raised interventions against it. |
| Blocked | Requests this guardrail stopped. |
| Informed | Requests this guardrail matched and logged, but allowed through. |
| Trigger rate | Triggered requests divided by evaluated requests. |
| Last seen | The latest request where this guardrail was evaluated, whether or not it triggered. |
A guardrail triggers when it raises interventions against a request. Whether that blocked the request or only informed the employee comes from the request itself, not from the guardrail's own setting: the policy applying a guardrail can enforce one that is configured to inform, and then the request is blocked. The tag beside each guardrail name shows how it is configured where it ran, which is why a guardrail marked Set to inform can still show blocked requests.
Requests blocked by FireTail's own checks rather than by a configured guardrail carry no guardrail UUID, so they appear in the Guardrails card's totals but cannot be attributed to a row here.
Click a guardrail for totals, an outcome breakdown over time, matching requests, common interventions, and per-client and per-platform splits. Expand a request to read the prompt that was evaluated — what the employee last said — along with the tail of the conversation for context, the interventions it raised and their reasons, and the model and where the guardrail ran.
Content is read only for the page of requests on show, and long messages are truncated. A conversation can run to dozens of messages, so only its last few are shown; the header says how many there were in total. If the content cannot be read, the requests are still listed and the counts are unaffected. UUIDs remain available to copy when a definition has been deleted or its name cannot be resolved.
Guardrails evaluated in the client table counts distinct guardrails seen in that client's requests during the period, including ones that never triggered. Click a nonzero count to filter the Guardrail activity section to that client. This count is included in the usage CSV. It measures observed activity, rather than configured guardrails.
One request can evaluate several guardrails, so counts across guardrails can exceed the overall request count. Unevaluated guardrails and unknown consumption types are excluded. Reports include only clients granting read-only or admin access, within your existing MSP permissions.
If a report is too large, select a shorter period or fewer clients. Unavailable means the report could not be completed; it does not mean zero activity. Recent data can take up to 30 seconds to appear after indexing.