
Workload Usage Dashboard
Updated: July 31, 2026
The Workload Usage Dashboard provides a real-time overview of your organization's AI connections, offering insights into AI services, resources, logs, and token usage. It helps monitor and manage AI interactions across different providers.
Navigation
To access the Workload Usage Dashboard:
- In the side menu, go to Dashboards.
- Click on the Workload Usage indicator near the top of the page.
Use the duration selector in the top right of the page to change the period every chart covers.
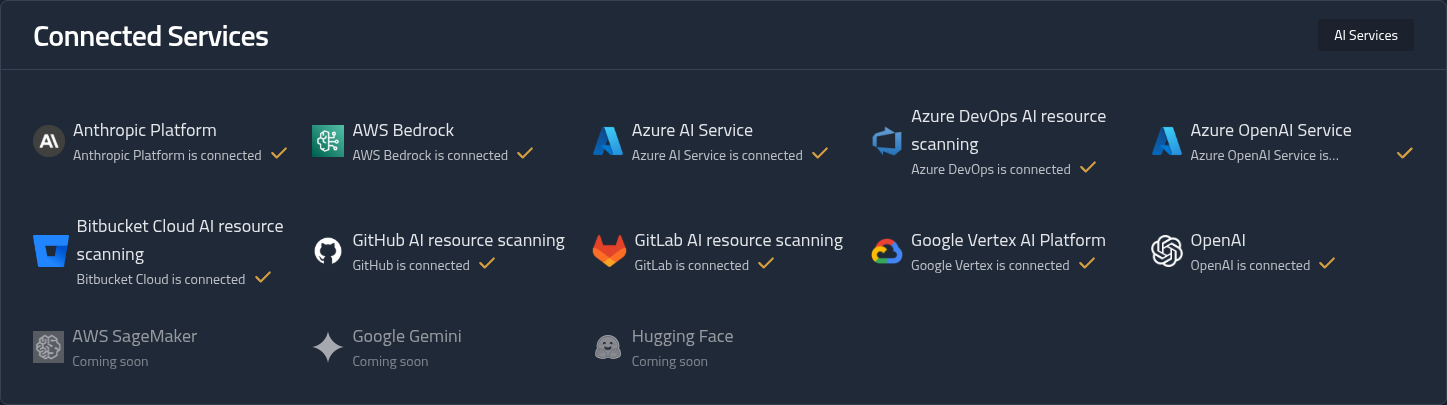
Connected Services
AI services act as the interface between users and AI models, processing inputs and returning outputs. This section displays:
- All connected AI services
- Available AI services that can be connected, and those marked Coming soon
To add new services, click an available service on the dashboard. Learn more here.
Summary
Resources Grouped by Provider
This section organizes AI resources by provider (for example, Anthropic, Amazon, Google Cloud, OpenAI) and displays:
- Number of models discovered
- Number of prompts
- Logs
- Input and output tokens
- Total tokens per provider
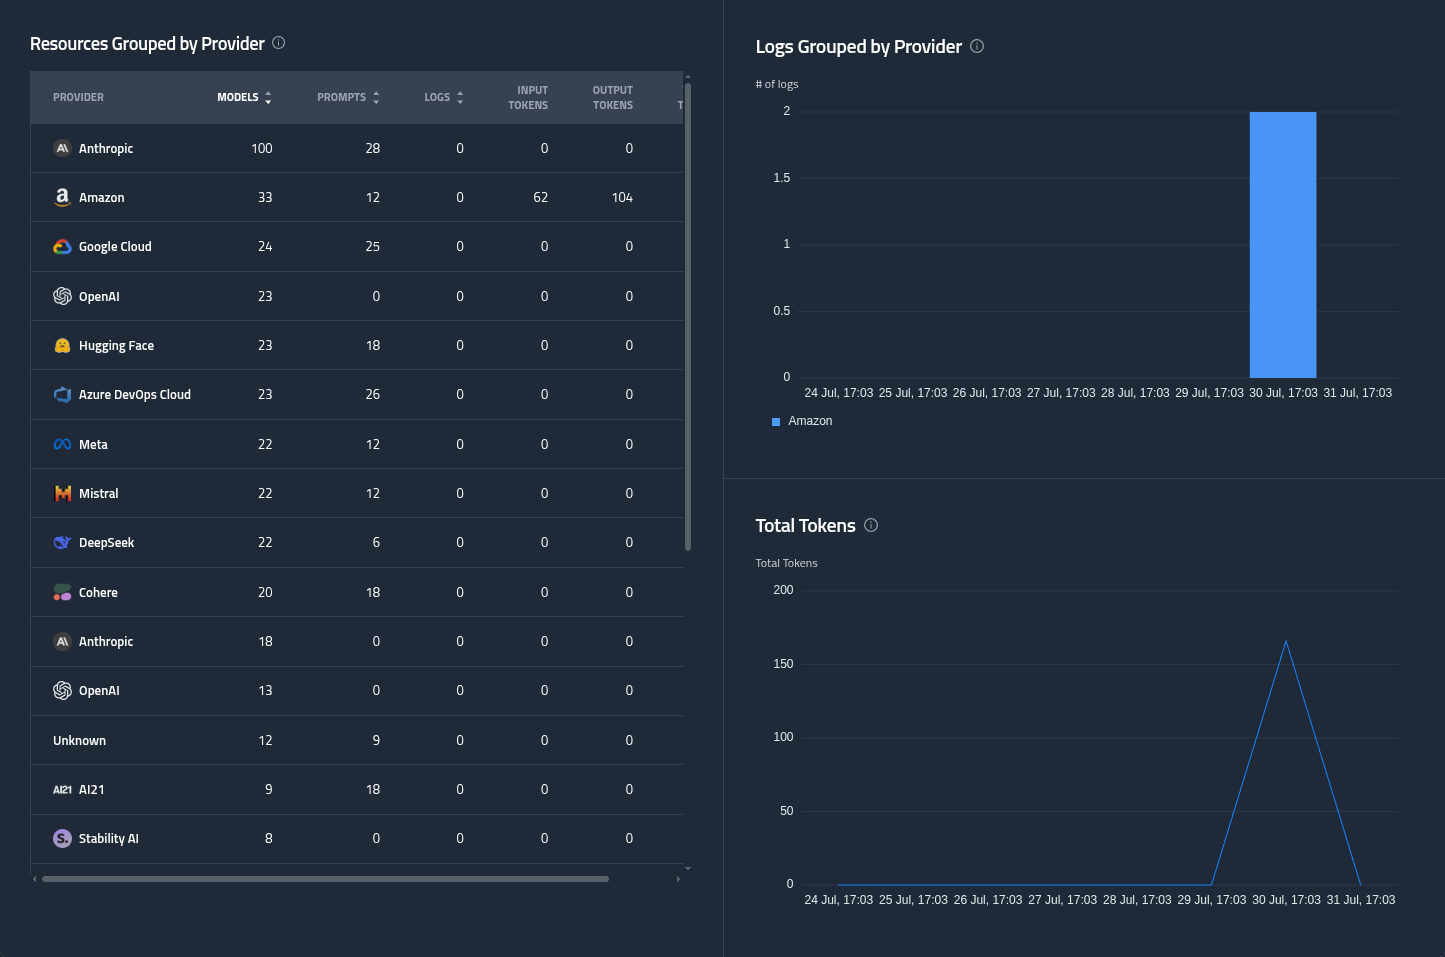
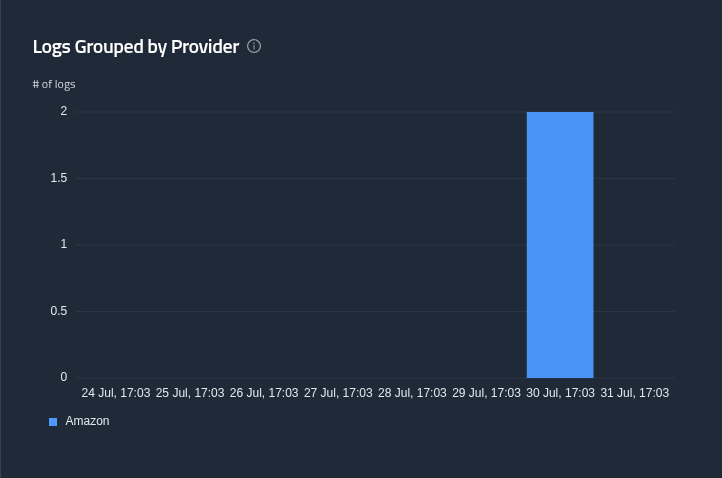
Logs Grouped by Provider
A chart displaying the number of logs generated by each AI service over the selected time period. Hover over the chart to see a breakdown of logs per provider for each time period.
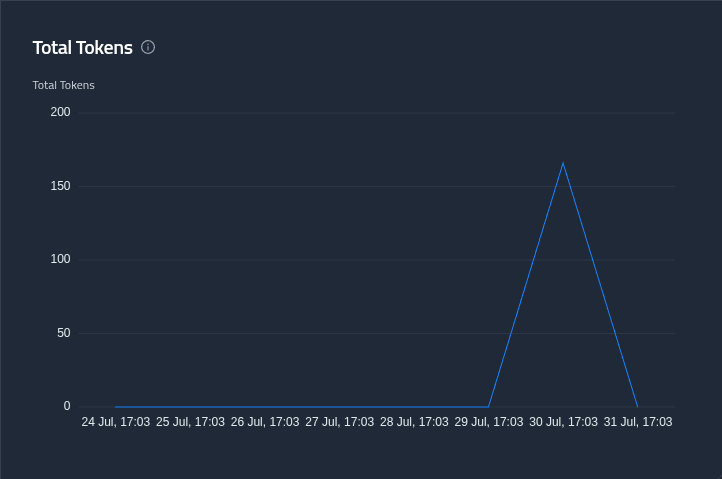
Total Tokens
A graph showing token usage trends over time. Hover over the graph for a detailed breakdown of token metrics by date.
Log Volume
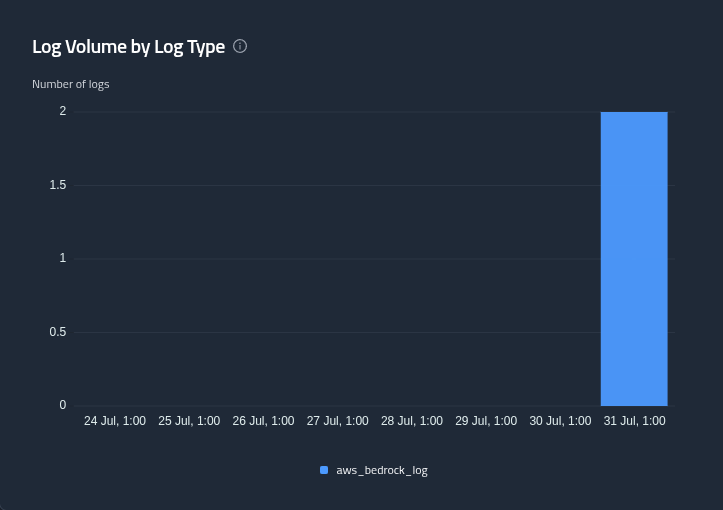
Log Volume by Log Type
Cloud log volume over time, broken down by the type of log recorded.
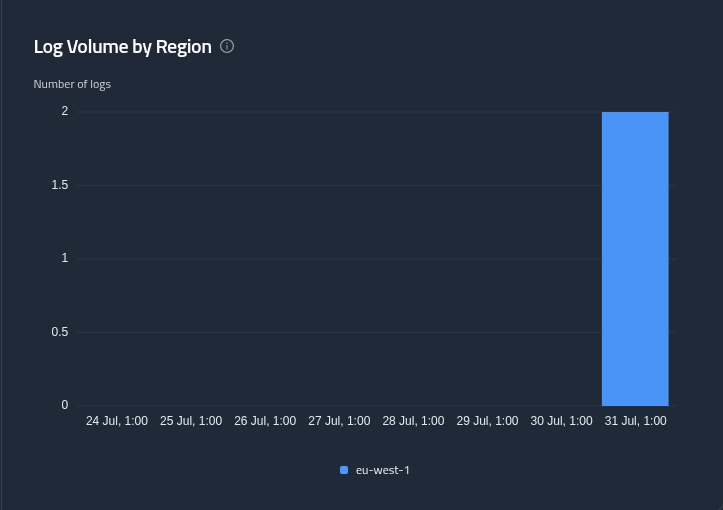
Log Volume by Region
The same log volume split by the cloud region the activity came from, which helps surface unexpected regional usage.
Token Usage
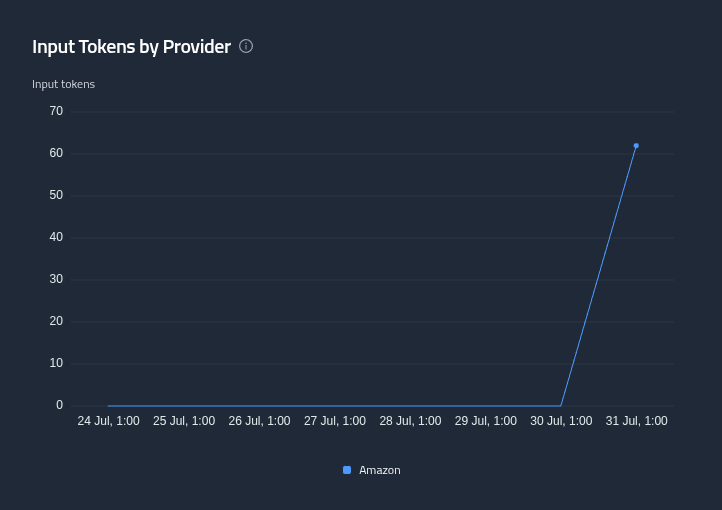
Input Tokens by Provider
Input token consumption over the selected period, with a line per provider.
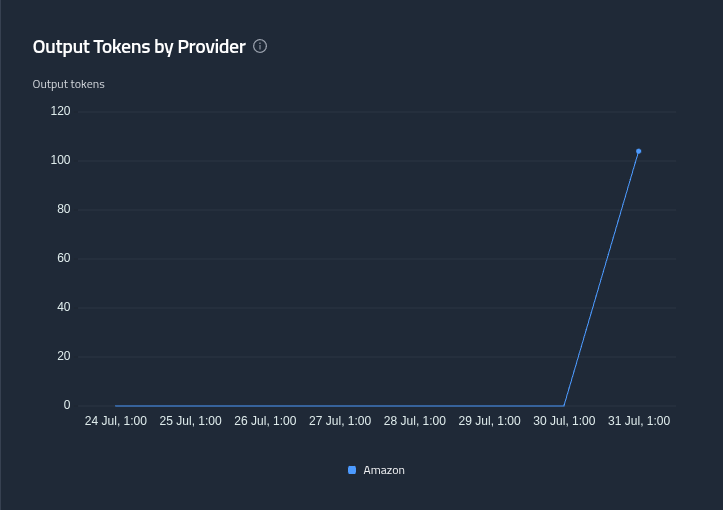
Output Tokens by Provider
Output token consumption over the selected period, with a line per provider.
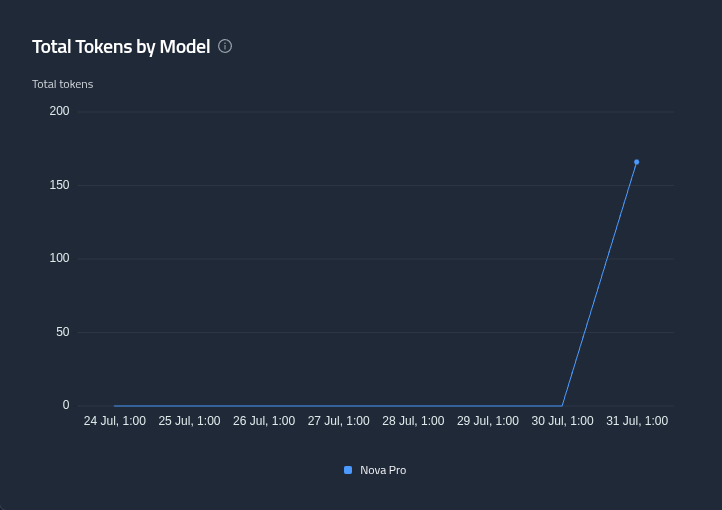
Total Tokens by Model
Total token consumption attributed to each model, which identifies the models driving the most usage.
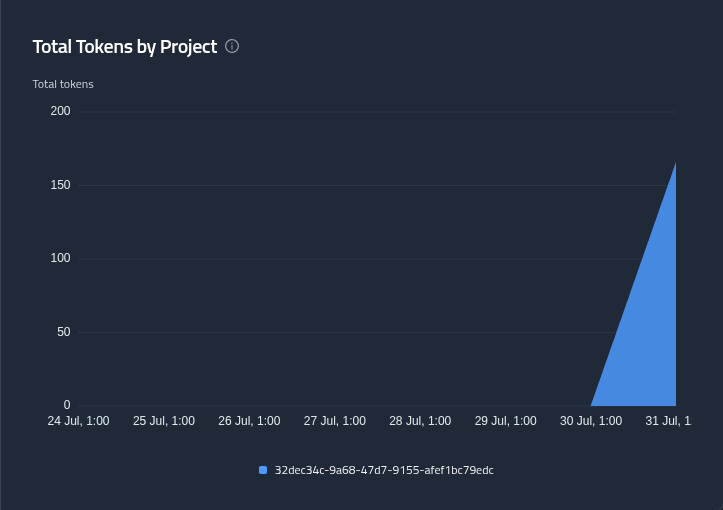
Total Tokens by Project
Total token consumption attributed to each project, for chargeback or budget tracking.