

Workload Risk Dashboard
Updated: July 31, 2026
The Workload Risk Dashboard provides a real-time overview of your organization's AI Workload risk, helping you identify and prioritize the AI services that pose the greatest risk across your organization.
Navigation
To access the Workload Risk Dashboard:
- In the side menu, go to Dashboards.
- Click on the Workload Risk indicator near the top of the page.
Use the duration selector in the top right of the page to change the period every chart covers.
Risk Trends
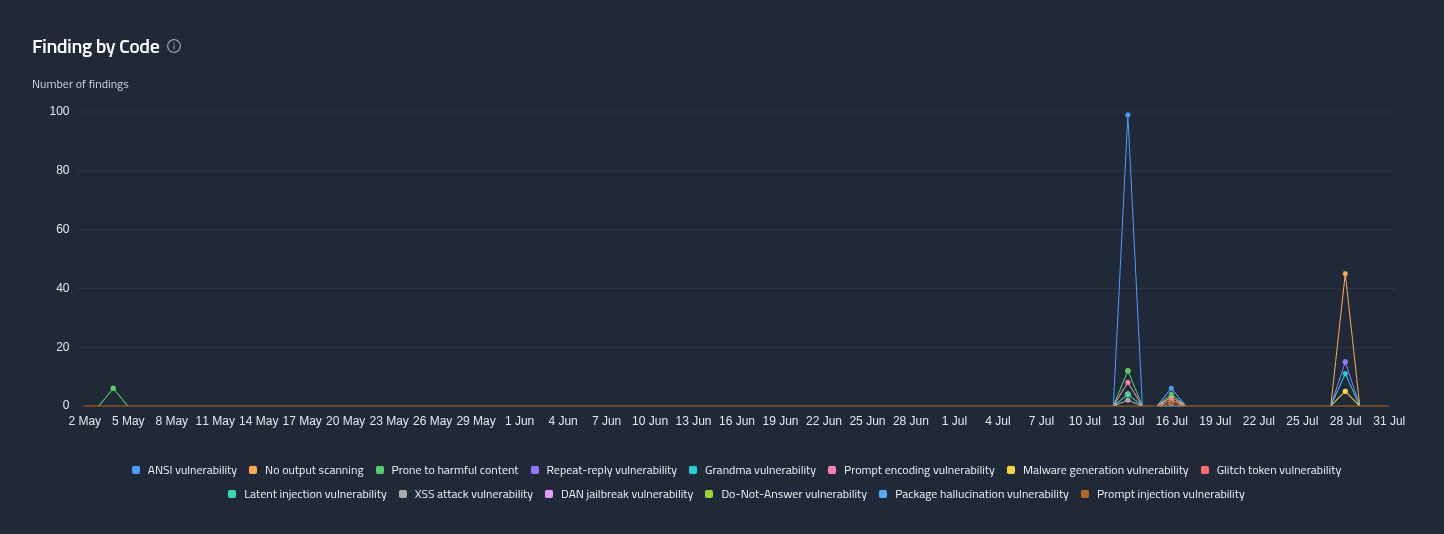
Finding by Code
Finding volume over time, broken down by finding code, which shows which specific issues are driving your risk.
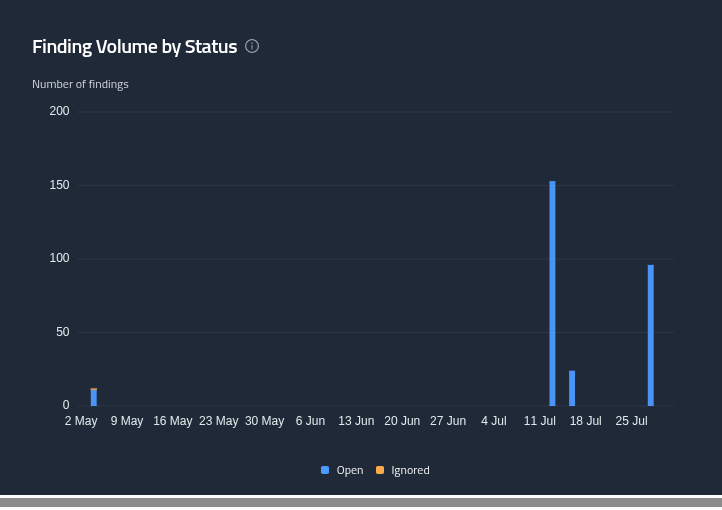
Finding Volume by Status
Finding volume over the selected period grouped by status, so you can see how much of your backlog is open versus remediated.
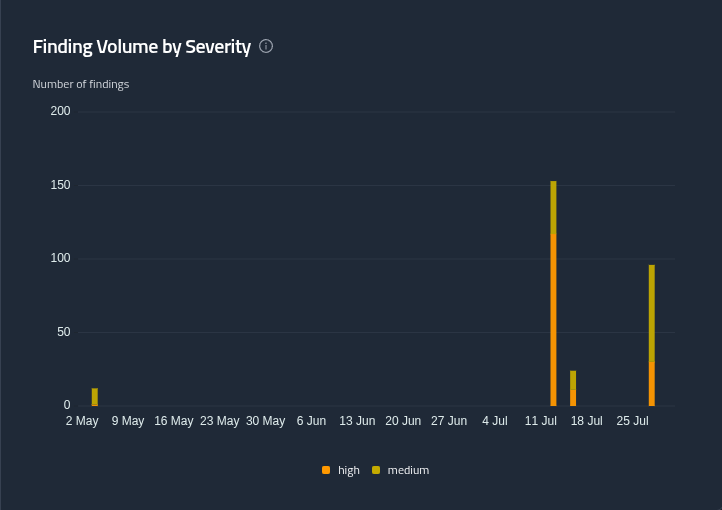
Finding Volume by Severity
The same volume grouped by severity, from Information through to Critical.
Risk Summary
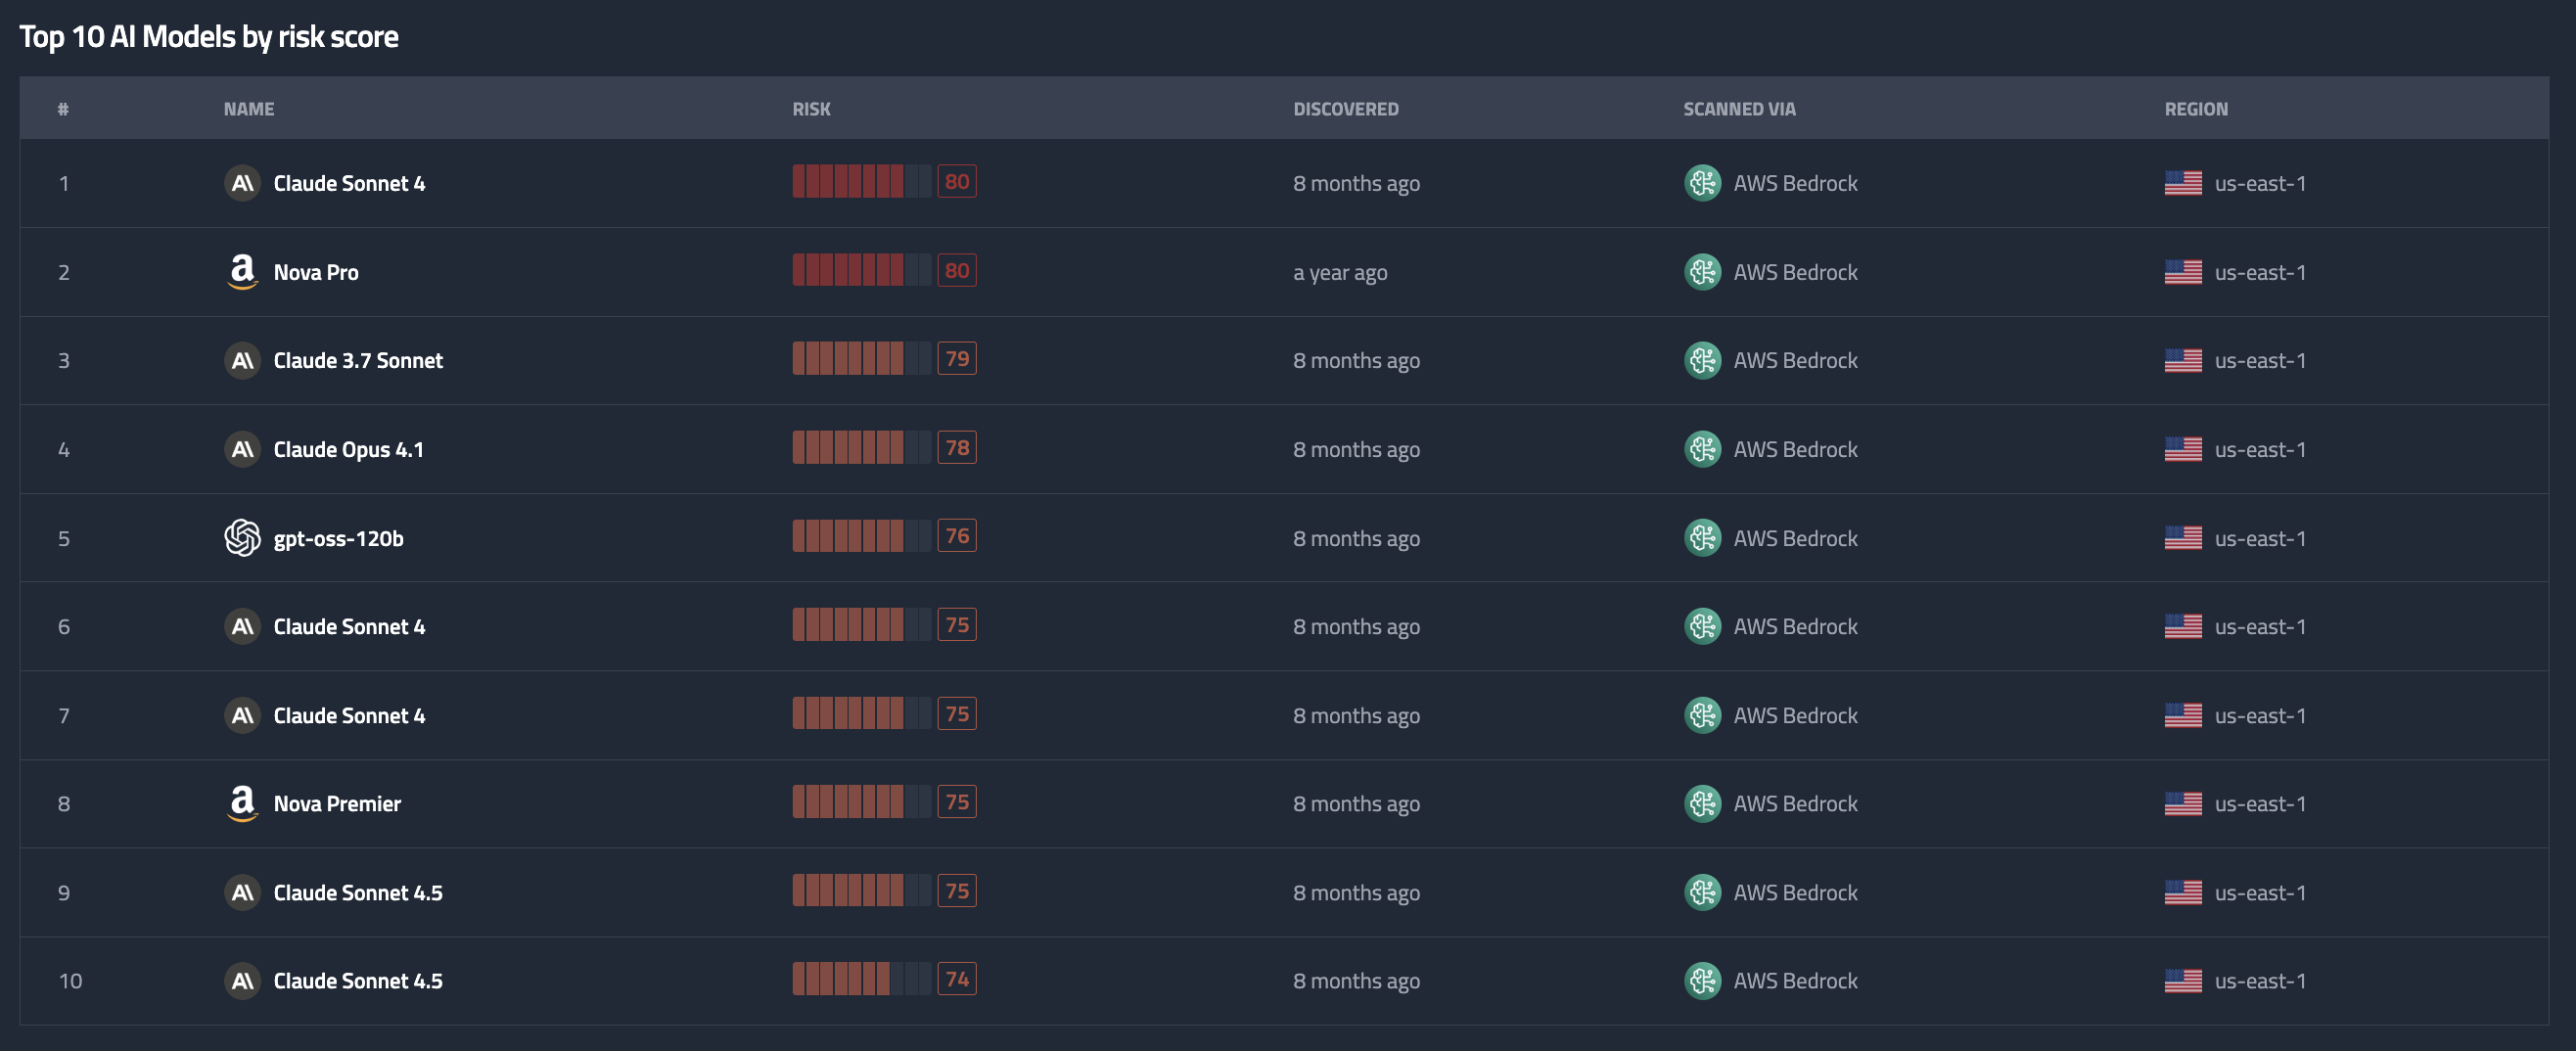
Top 10 AI Models by risk score
A table displaying the ten highest-risk AI models, with each model's risk score, when it was discovered, what it was scanned via, and its region. Click on an AI Model to view more details.
Learn more about AI Models and AI Findings.