

Workforce Usage Dashboard
Updated: July 31, 2026
The Workforce Usage Dashboard provides a real-time overview of your organization's workforce activity, offering insights into platform consumption and employee activity. It helps monitor and manage how your workforce interacts with different AI platforms.
Navigation
To access the Workforce Usage Dashboard:
- In the side menu, go to Dashboards.
- Click on the Workforce Usage indicator near the top of the page.
Use the duration selector in the top right of the page to change the period every chart covers.
Log Activity
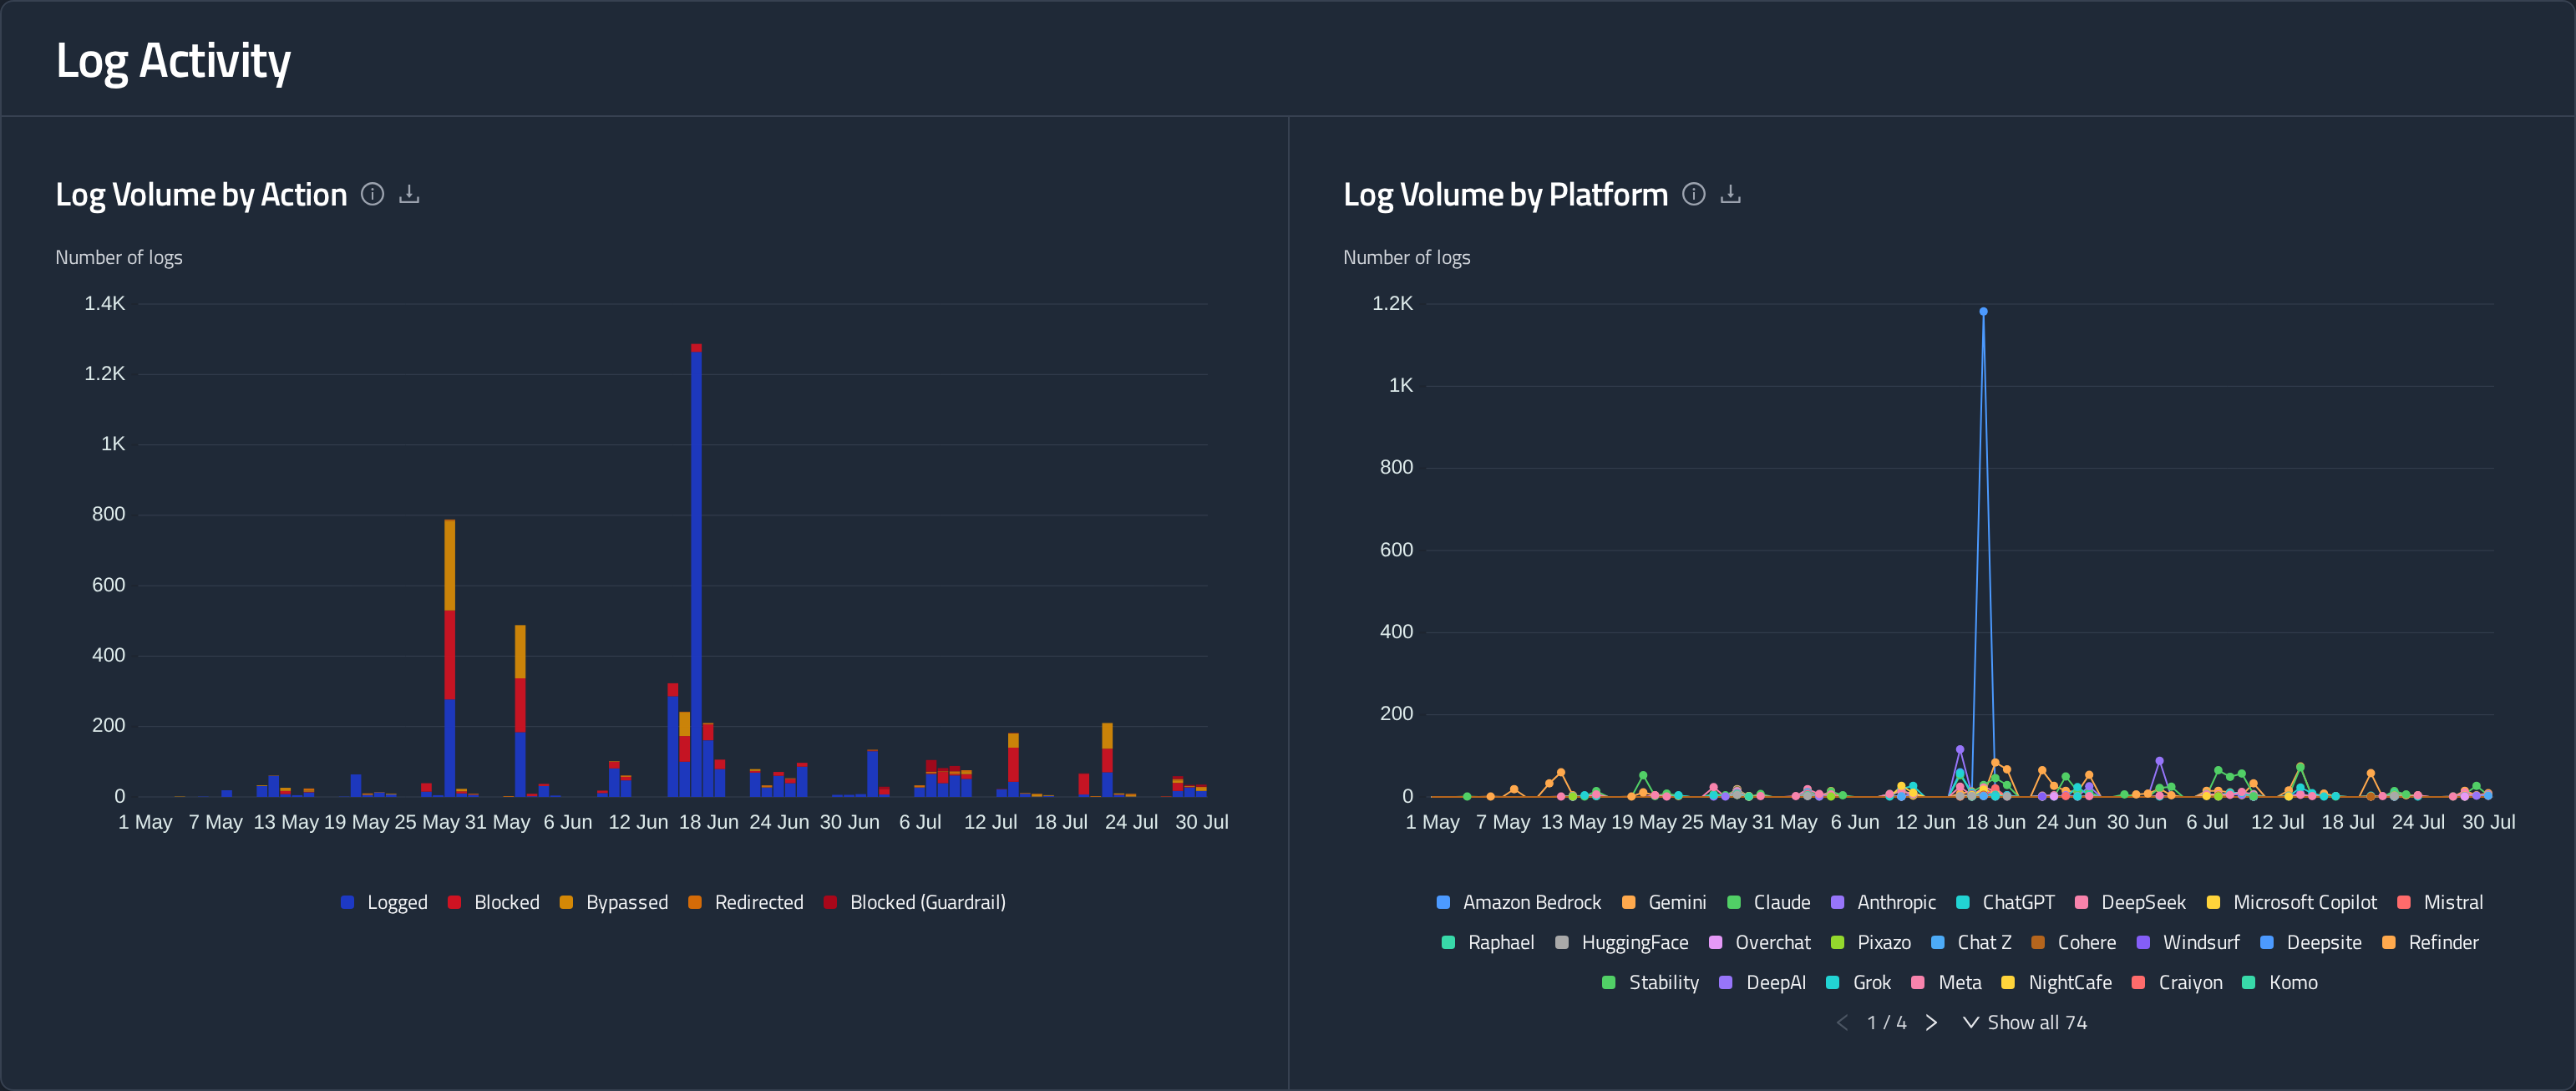
Employee AI log volume over time, in two views:
- Log Volume by Action: Stacked columns showing how your policies handled employee AI usage, split by action (Logged, Blocked, Bypassed, Redirected and Blocked (Guardrail)).
- Log Volume by Platform: A line per AI platform, showing which platforms your employees use most.
Click a series in the key below either chart to plot only that series; click it again to remove it. Hover over the chart to see a breakdown for each time period.
Token Usage
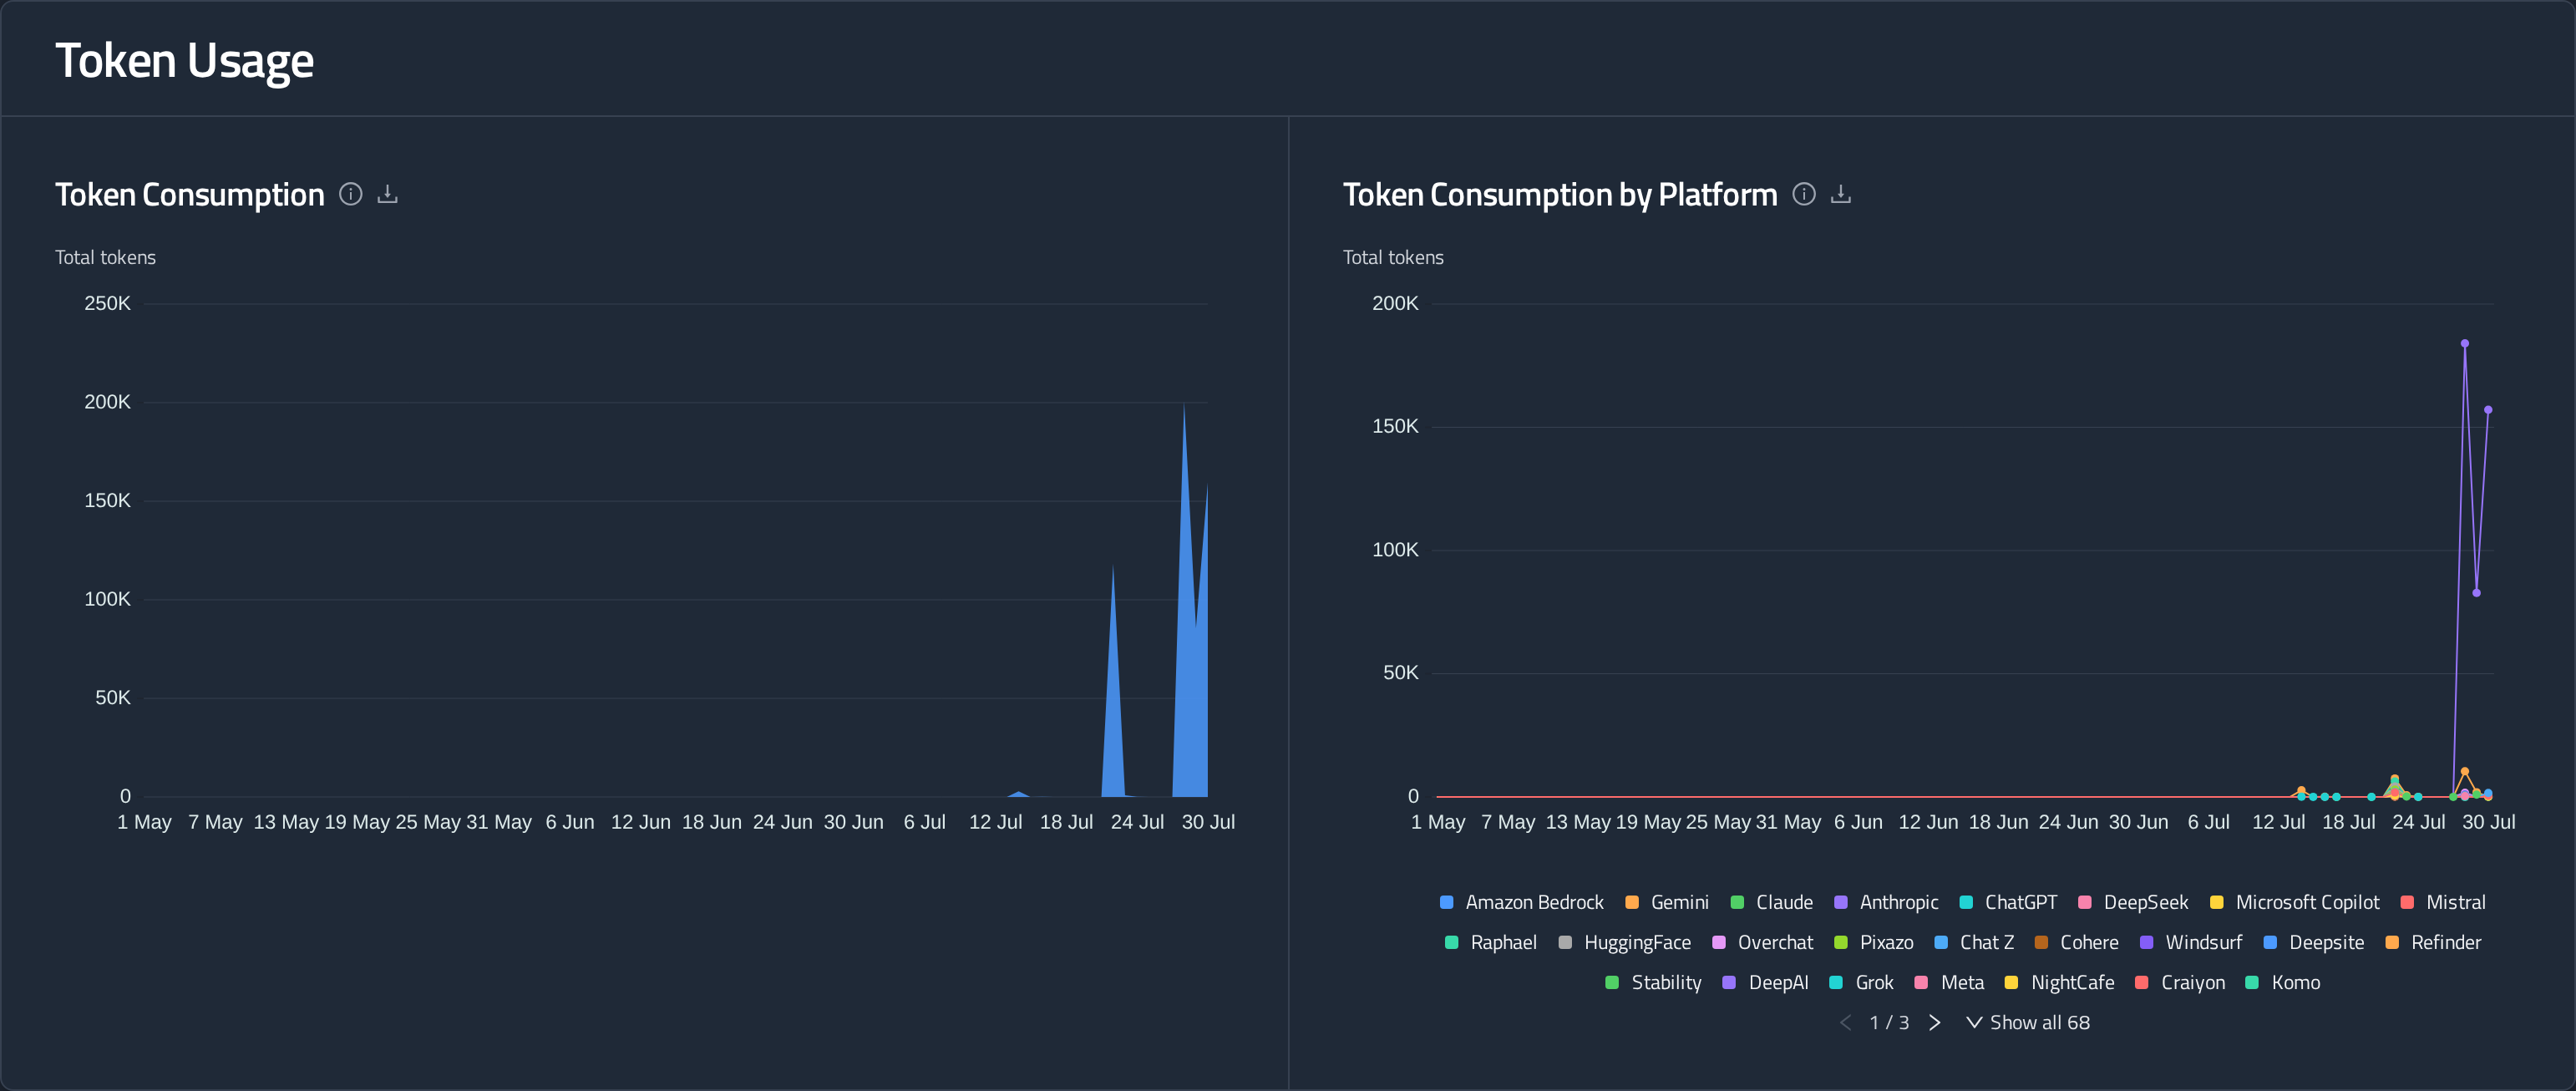
Token consumption over the selected period, in two views:
- Token Consumption: Total tokens generated by employee AI usage over time.
- Token Consumption by Platform: The same total, split into a line per AI platform, showing which platforms drive the most usage.
Top Consumers
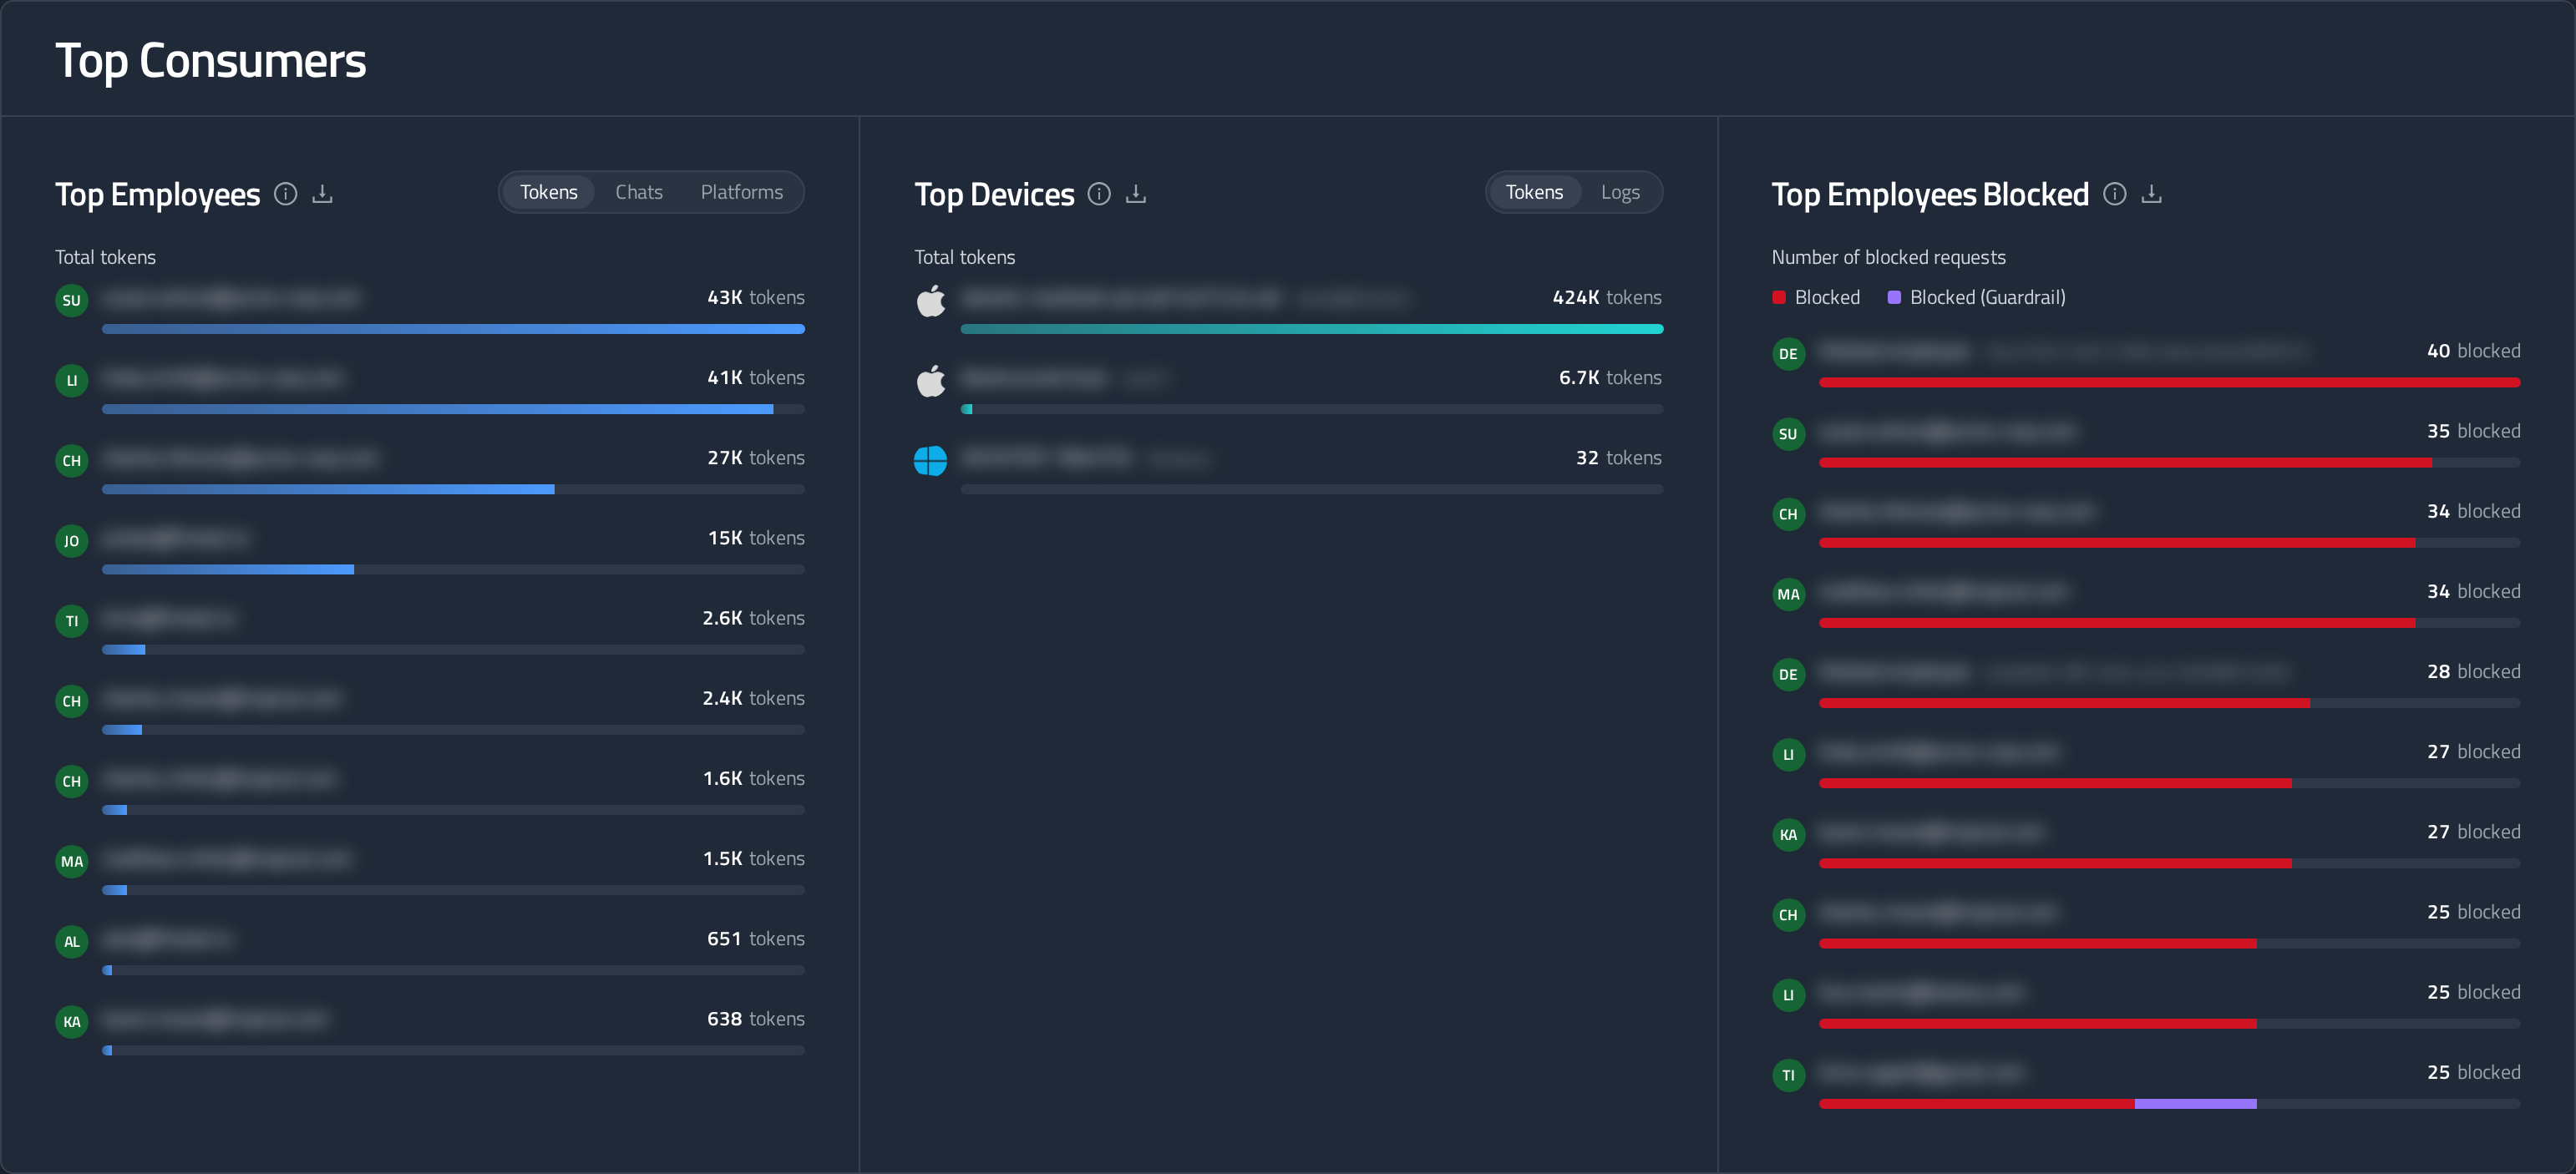
Who is generating the activity. Each chart ranks the ten highest for the selected period, and clicking a row opens that record.
- Top Employees: The heaviest AI users. Switch between Tokens, Chats and Platforms (the number of different AI platforms the employee used) with the toggle beside the title. The logos on each row show the platforms that employee reached for.
- Top Devices: The devices sending the most employee AI activity, by Tokens or Logs, which surfaces shared or unusually busy machines.
- Top Employees Blocked: The employees whose AI usage was stopped most often, with each bar split between policy blocks and guardrail blocks. Clicking a row opens that employee's blocked logs.
Usage Breakdown
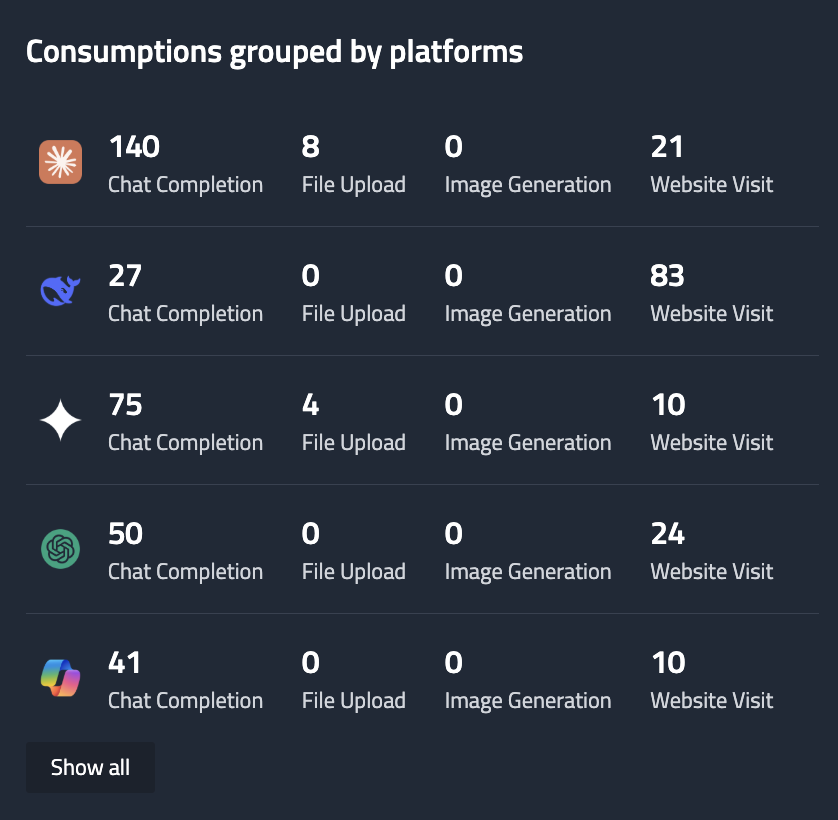
Usage Grouped by Platforms
This section organizes consumptions by platform and displays:
- Number of Chats
- Number of File Uploads
- Number of Image Generations
- Number of Website Visits
Every platform is drawn on the same scale, so bar lengths are comparable between rows. Click a bar or a platform name to open that platform.
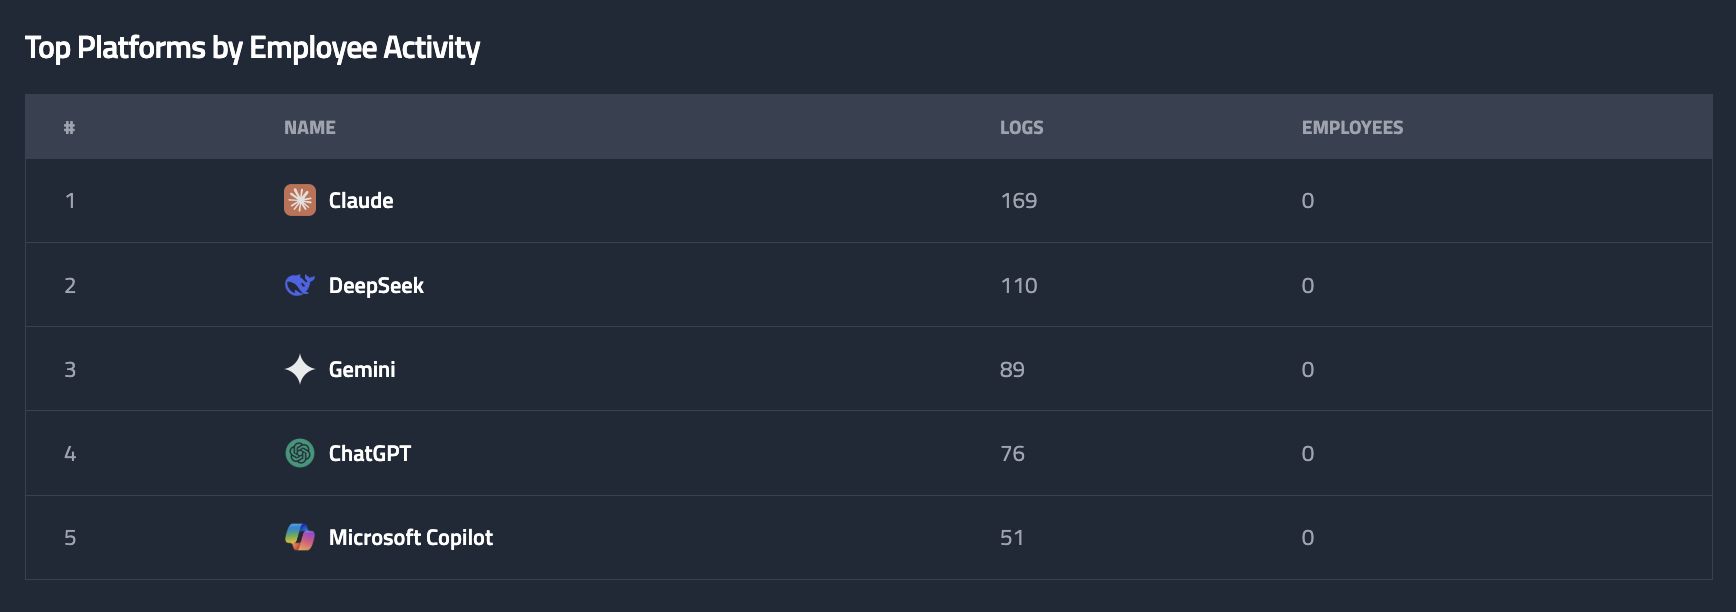
Top Platforms by Employee Activity
A table displaying the platforms ranked by employee activity. For each platform, the table shows:
- Platform name
- Number of logs
- Number of employees
Downloading chart data
Every chart on this dashboard can be exported to CSV. Click the download icon beside the chart title.

The file contains exactly what the chart is showing at the time you click:
- Only the period selected in the duration selector.
- Only the series you have selected in the chart's key, where the chart has one.
- The metric selected in the toggle, for Top Employees and Top Devices.
The file is named after the chart and the period it covers, for example
token-consumption-by-platform_2026-05-01-0900_to_2026-07-30-0900.csv, so downloads of the same chart over different periods don't overwrite each other.
The download icon is hidden while a chart has no data for the selected period.